Jaeger-operator: Jaeger Operator 403 k8s api requests
Hi,
It seems the jeager operator is making requests to the k8s api and it's getting 403.
Details:
Deployment details:
Name:                   jaeger-operator
Namespace:              observability
CreationTimestamp:      Fri, 04 Sep 2020 12:28:25 +0100
Labels:                 app.kubernetes.io/instance=jaeger-dev
Annotations:            deployment.kubernetes.io/revision: 9
Selector:               name=jaeger-operator
Replicas:               1 desired | 1 updated | 1 total | 1 available | 0 unavailable
StrategyType:           RollingUpdate
MinReadySeconds:        0
RollingUpdateStrategy:  25% max unavailable, 25% max surge
Pod Template:
  Labels:           name=jaeger-operator
  Annotations:      prometheus.io/path: /metrics
                    prometheus.io/port: 8383
                    prometheus.io/scrape: true
  Service Account:  jaeger-operator
  Containers:
   jaeger-operator:
    Image:       jaegertracing/jaeger-operator:1.20.0
    Ports:       8383/TCP, 8686/TCP
    Host Ports:  0/TCP, 0/TCP
    Args:
      start
    Limits:
      cpu:     250m
      memory:  128Mi
    Requests:
      cpu:     100m
      memory:  64Mi
    Environment:
      WATCH_NAMESPACE:
      POD_NAME:          (v1:metadata.name)
      POD_NAMESPACE:     (v1:metadata.namespace)
      OPERATOR_NAME:    jaeger-operator
    Mounts:             <none>
  Volumes:              <none>
Conditions:
  Type           Status  Reason
  ----           ------  ------
  Available      True    MinimumReplicasAvailable
  Progressing    True    NewReplicaSetAvailable
OldReplicaSets:  <none>
NewReplicaSet:   jaeger-operator-5b45f475c9 (1/1 replicas created)
Events:          <none>
Installation was done by following https://www.jaegertracing.io/docs/1.20/operator/#installing-the-operator-on-kubernetes with cluster wide permissions.
We were alerted to the 403 rest client requests:
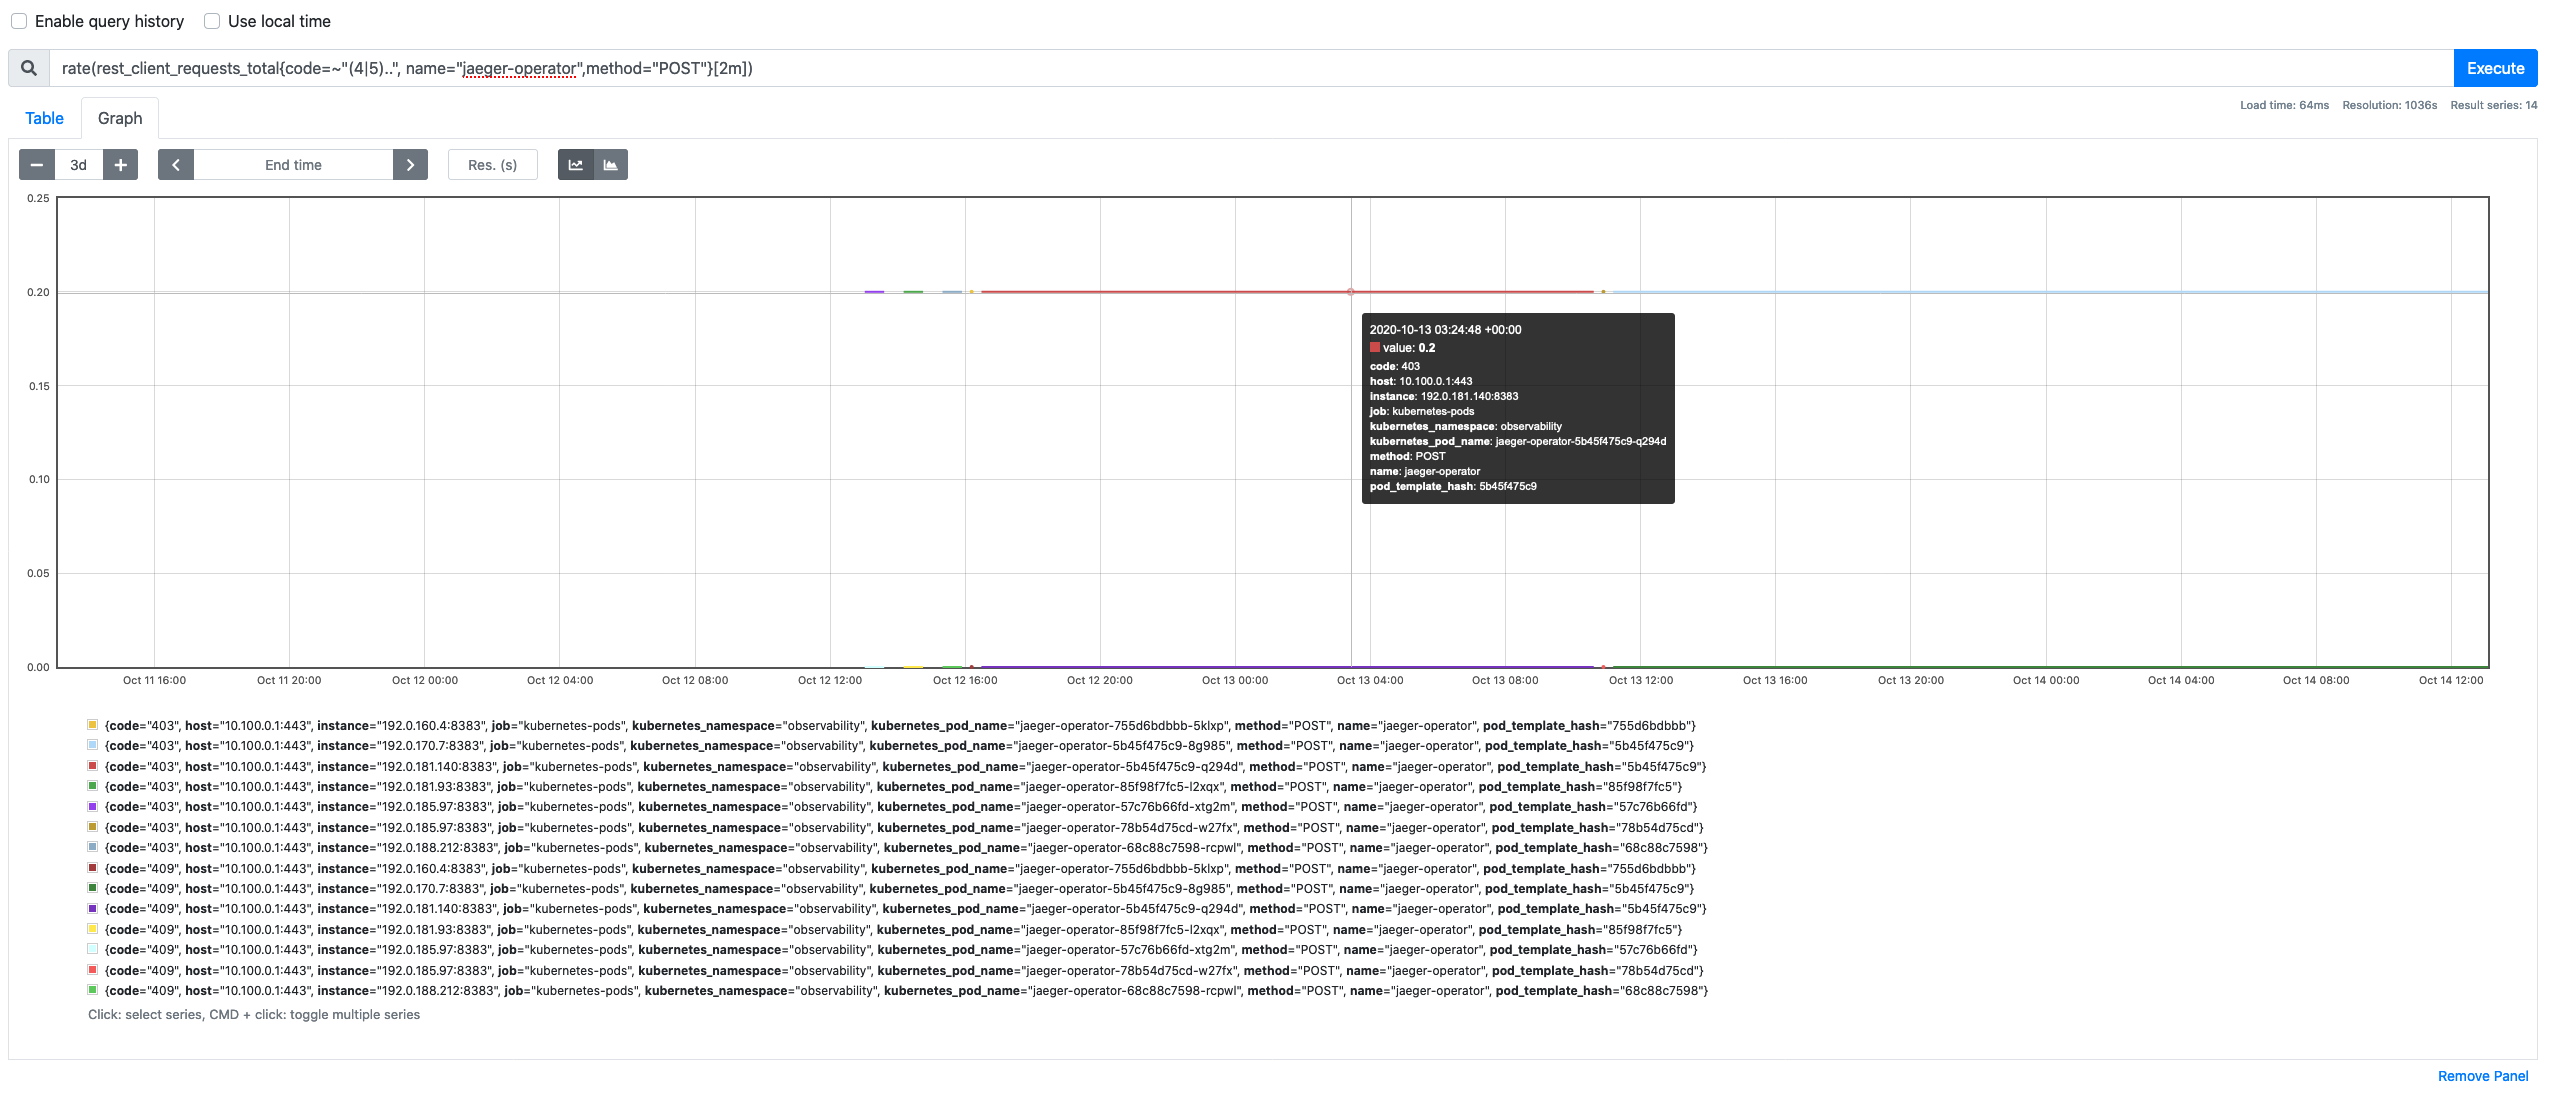
{code="403",host="10.100.0.1:443",instance="192.0.170.7:8383",job="kubernetes-pods",kubernetes_namespace="observability",kubernetes_pod_name="jaeger-operator-5b45f475c9-8g985",method="POST",name="jaeger-operator",pod_template_hash="5b45f475c9"} 0.2
Prometheus rate graph with details
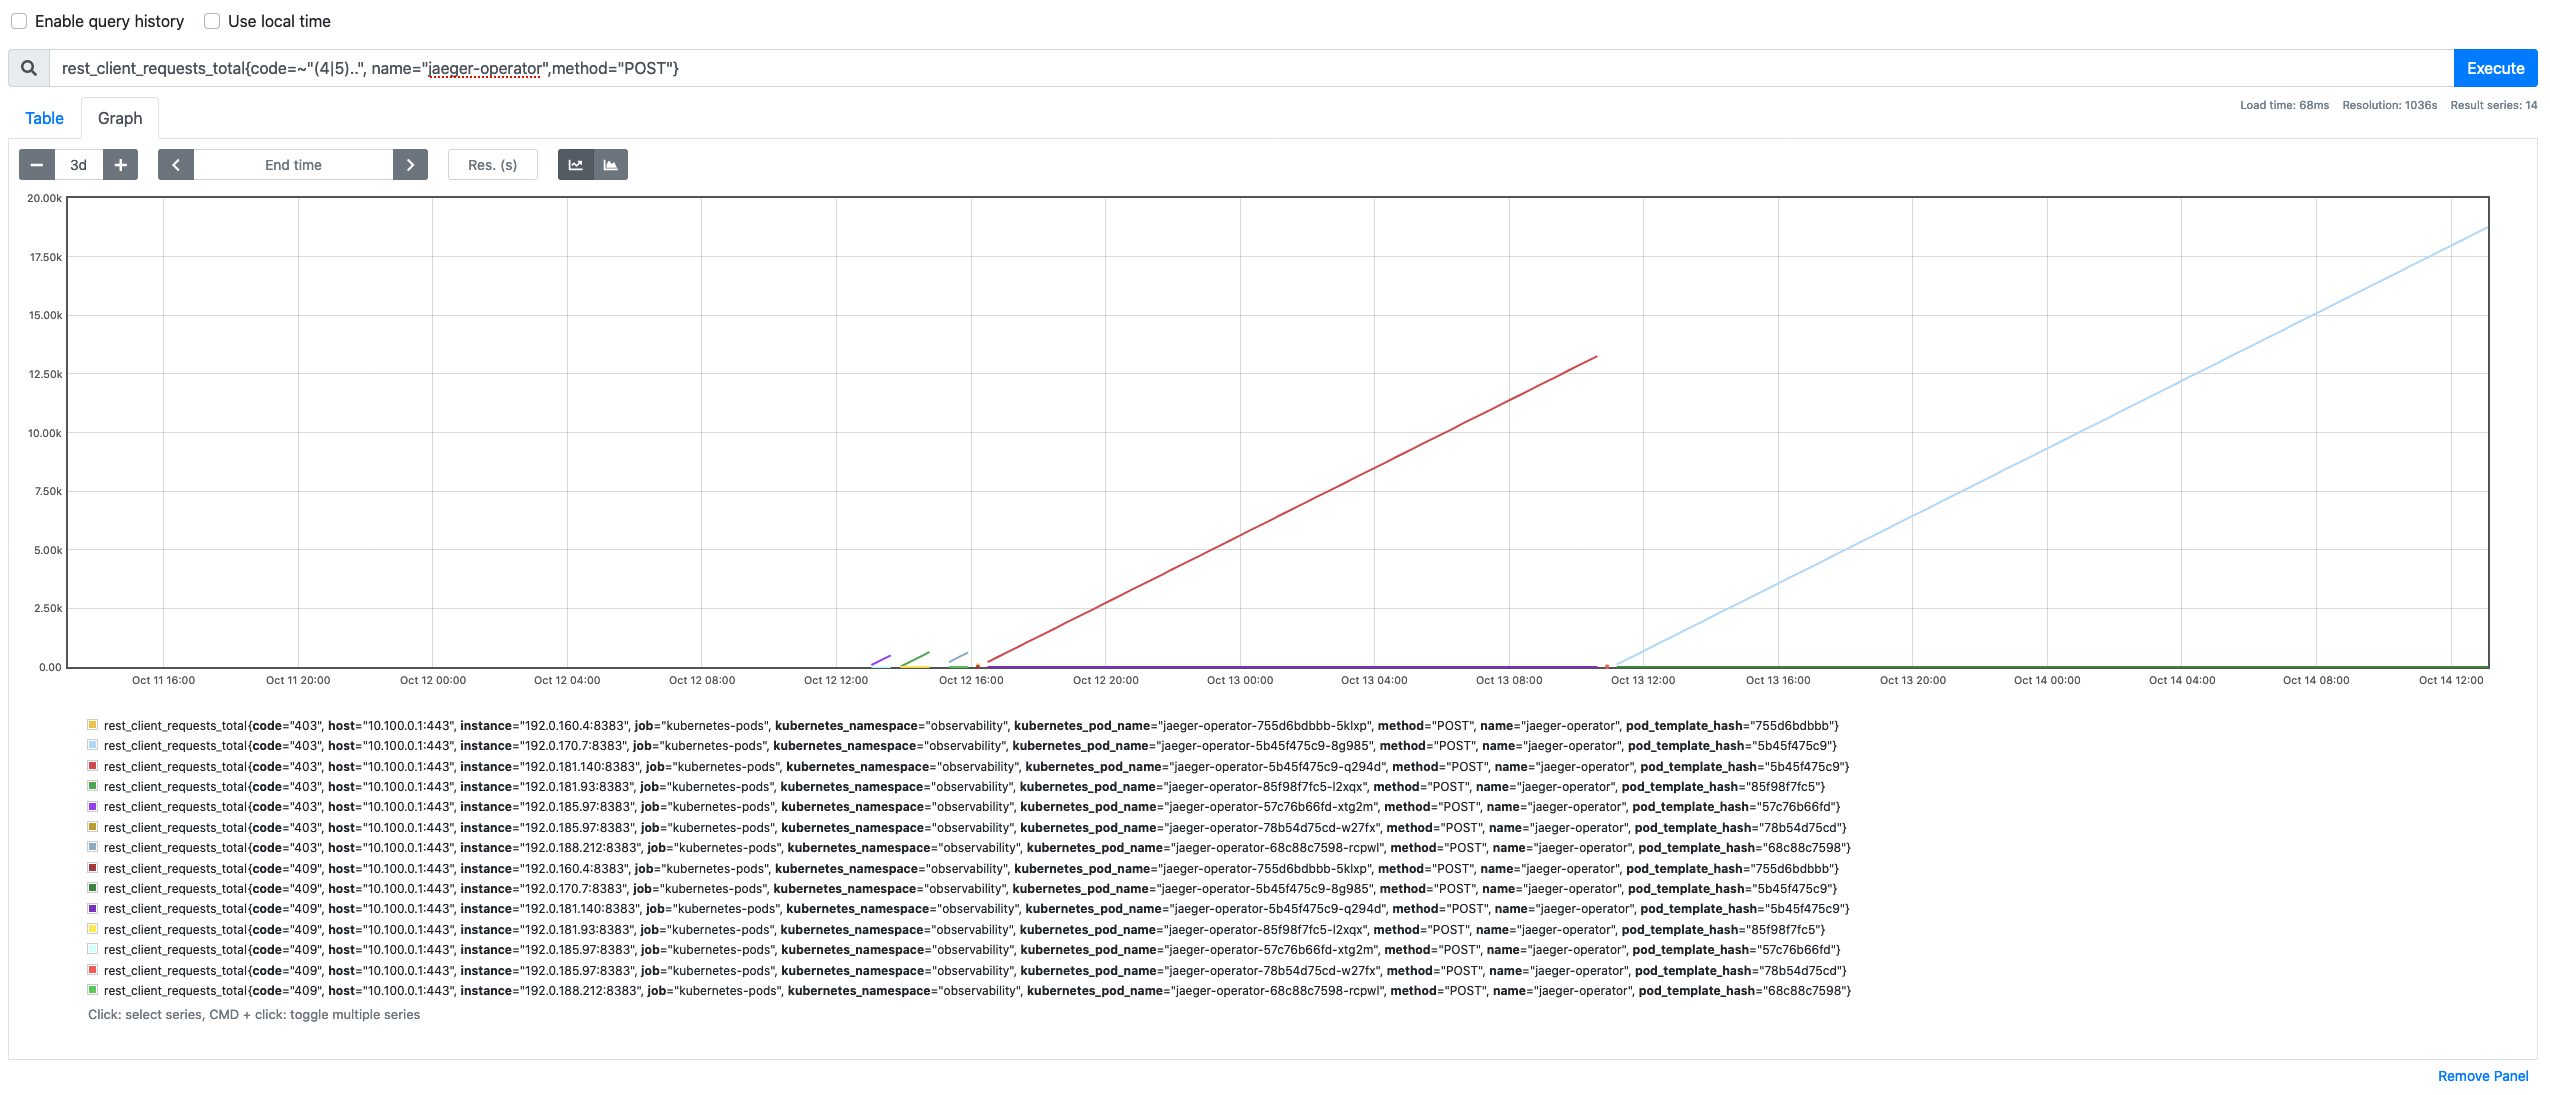
Prometheus graph without rate details
Kubelet logs do not have anything useful in them regarding this.
RBAC permissions have been re-created to make sure we're using the ones from the tutorial (that's why you see a second line in the non rate graphs).
How could I continue this investigation?
 akosveres
All 11 comments
Could you try running the operator with debug logs enabled? Perhaps there's a clue in there.
In this line:
Add the log-level=debug flag, like this:
args: ["start", "--log-level=debug"]
 jpkrohling
on 14 Oct 2020
jpkrohling
on 14 Oct 2020
Done, new pod came up, error rates going up based on the graphs:
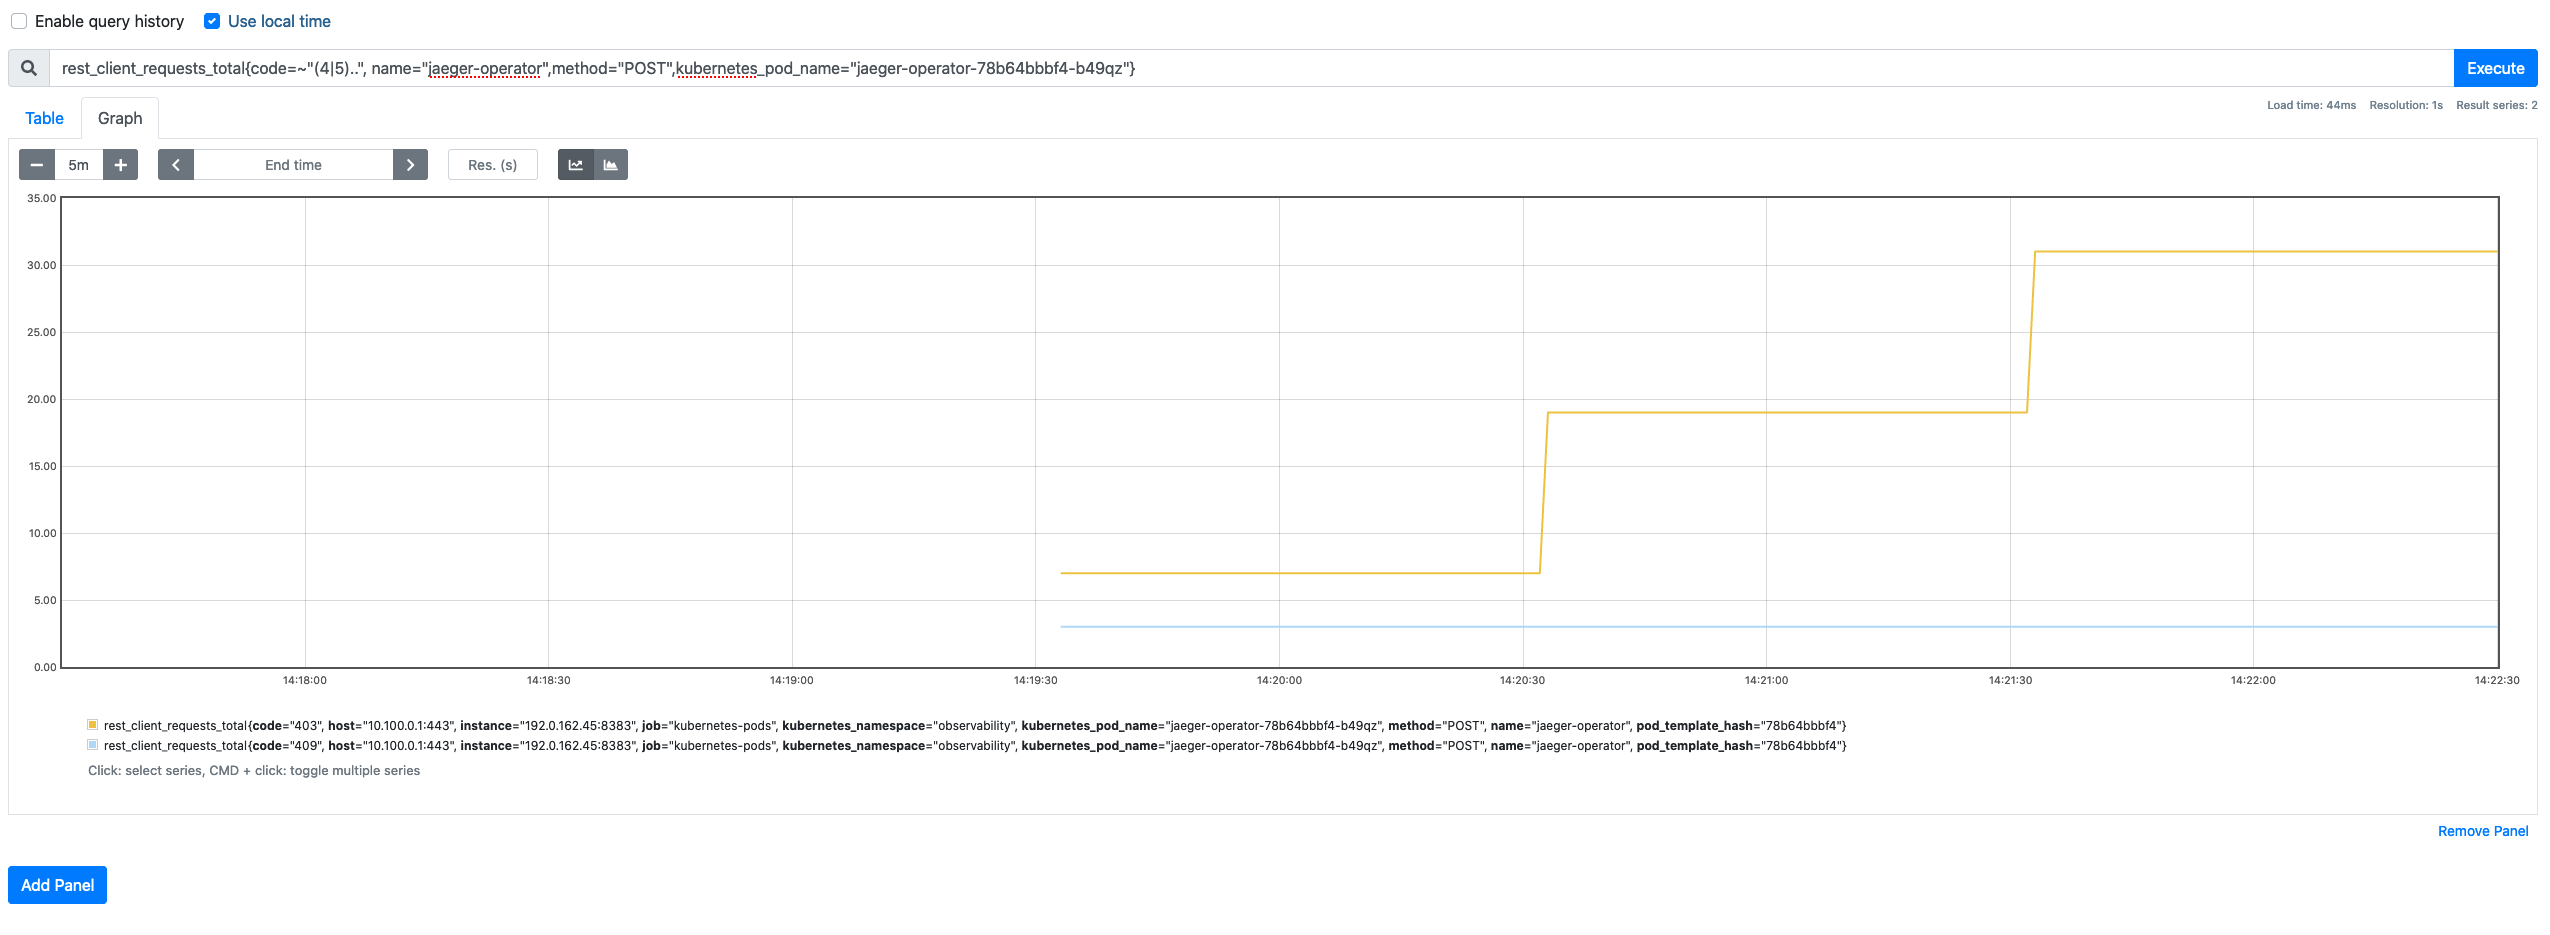
Logs from the operator:
time="2020-10-14T13:18:56Z" level=info msg=Versions arch=amd64 identity=observability.jaeger-operator jaeger=1.20.0 jaeger-operator=v1.20.0 operator-sdk=v0.18.2 os=linux version=go1.14.4
time="2020-10-14T13:19:01Z" level=info msg="Auto-detected the platform" platform=kubernetes
time="2020-10-14T13:19:01Z" level=info msg="Auto-detected ingress api" ingress-api=networking
time="2020-10-14T13:19:01Z" level=info msg="Automatically adjusted the 'es-provision' flag" es-provision=no
time="2020-10-14T13:19:01Z" level=info msg="Automatically adjusted the 'kafka-provision' flag" kafka-provision=no
time="2020-10-14T13:19:01Z" level=info msg="The service account running this operator does not have the role 'system:auth-delegator', consider granting it for additional capabilities"
time="2020-10-14T13:19:03Z" level=info msg="Install prometheus-operator in your cluster to create ServiceMonitor objects" error="no ServiceMonitor registered with the API"
time="2020-10-14T13:19:03Z" level=debug msg="Not running on OpenShift, so won't configure OAuthProxy imagestream."
time="2020-10-14T13:19:03Z" level=debug msg="Reconciling Jaeger" execution="2020-10-14 13:19:03.504598507 +0000 UTC" instance=jaeger namespace=observability
time="2020-10-14T13:19:03Z" level=debug msg="Strategy chosen" instance=jaeger namespace=observability strategy=allinone
time="2020-10-14T13:19:03Z" level=debug msg="Creating all-in-one deployment" instance=jaeger namespace=observability
time="2020-10-14T13:19:03Z" level=debug msg="Assembling the UI configmap" instance=jaeger namespace=observability
time="2020-10-14T13:19:03Z" level=debug msg="Assembling the Sampling configmap" instance=jaeger namespace=observability
time="2020-10-14T13:19:03Z" level=debug msg="Assembling an all-in-one deployment" instance=jaeger namespace=observability
time="2020-10-14T13:19:03Z" level=debug msg="skipping agent daemonset" instance=jaeger namespace=observability strategy=
time="2020-10-14T13:19:03Z" level=debug msg="updating service account" account=jaeger instance=jaeger namespace=observability
time="2020-10-14T13:19:03Z" level=debug msg="updating config maps" configMap=jaeger-ui-configuration instance=jaeger namespace=observability
time="2020-10-14T13:19:03Z" level=debug msg="updating config maps" configMap=jaeger-sampling-configuration instance=jaeger namespace=observability
time="2020-10-14T13:19:03Z" level=debug msg="updating service" instance=jaeger namespace=observability service=jaeger-collector
time="2020-10-14T13:19:03Z" level=debug msg="updating service" instance=jaeger namespace=observability service=jaeger-query
time="2020-10-14T13:19:03Z" level=debug msg="updating service" instance=jaeger namespace=observability service=jaeger-agent
time="2020-10-14T13:19:03Z" level=debug msg="updating service" instance=jaeger namespace=observability service=jaeger-collector-headless
time="2020-10-14T13:19:03Z" level=debug msg="updating deployment" deployment=jaeger instance=jaeger namespace=observability
time="2020-10-14T13:19:03Z" level=debug msg="Deployment has stabilized" desired=1 name=jaeger namespace=observability ready=1
time="2020-10-14T13:19:03Z" level=debug msg="Reconciling Jaeger completed" execution="2020-10-14 13:19:03.504598507 +0000 UTC" instance=jaeger namespace=observability
Do you get roughly one error per reconciliation, or do you get it periodically? Is it happening only with the Jaeger operator, or do you see something similar with other operators?
jpkrohling
on 14 Oct 2020
The reconciliation only happened once, while I see 12 403 errors / 60 seconds from the operator. I have no other 403 api rest client errors. The other HTTP error code I see is 409, which only happened 3 times at startup.
akosveres
on 14 Oct 2020
I need to dig into the code then and try to reproduce this, as I don't think we have periodic POSTs, only GETs as part of the auto-detection routine. We do try to update deployments if a new deployment is detected, but you don't have any logs about it, so, I would also discard this.
Last question before I start trying to reproduce: do you have any deployments in the watched namespaces that would be candidates for automatic sidecar (jaeger-agent) injection?
jpkrohling
on 14 Oct 2020
Yes, I do. Problems seem to have started since I enabled that. I am watching all namespaces and injection is successful, traces show up in jaeger ui. I didn't look at the deloyed Jaeger all-in-one because the alerts show the POST is coming from the operator pod/service account.
akosveres
on 14 Oct 2020
I found the cause for this: it's not really a problem, as it's just the operator trying to determine whether it has the system:auth-delegator permissions. Unfortunately, I'm unaware of a clean way of checking that, and seems like the recommended way to do it is by actually trying to create a dummy token review, like this:
To verify that this is indeed the cause, you can try granting the mentioned role to the jaeger-operator account and the failed POST should now become successful POST requests. You shouldn't grant this permission if you don't intend the operator to use this feature, though.
Is this causing a problem for you?
And finally, we might want to restrict this one to be executed only on OpenShift, as I don't think we benefit from this role for plain Kubernetes.
jpkrohling
on 14 Oct 2020
As always you're absolutely spot on. After applying a ClusterRoleBinding with the following all is fine:
apiVersion: rbac.authorization.k8s.io/v1
kind: ClusterRoleBinding
metadata:
  name: jaeger-operator-auth-delegator
subjects:
- kind: ServiceAccount
  name: jaeger-operator
  namespace: observability
roleRef:
  kind: ClusterRole
  name: system:auth-delegator
  apiGroup: rbac.authorization.k8s.io
The logs show it was successful:
time="2020-10-15T08:42:19Z" level=info msg="The service account running this operator has the role 'system:auth-delegator', enabling OAuth Proxy's 'delegate-urls' option"
There are no 403 or 409 calls from jaeger-operator anymore.
Thank you so much for your prompt investigation. Feel free to point me towards any documentation you think should be updated and I'd be happy to open a PR.
akosveres
on 15 Oct 2020
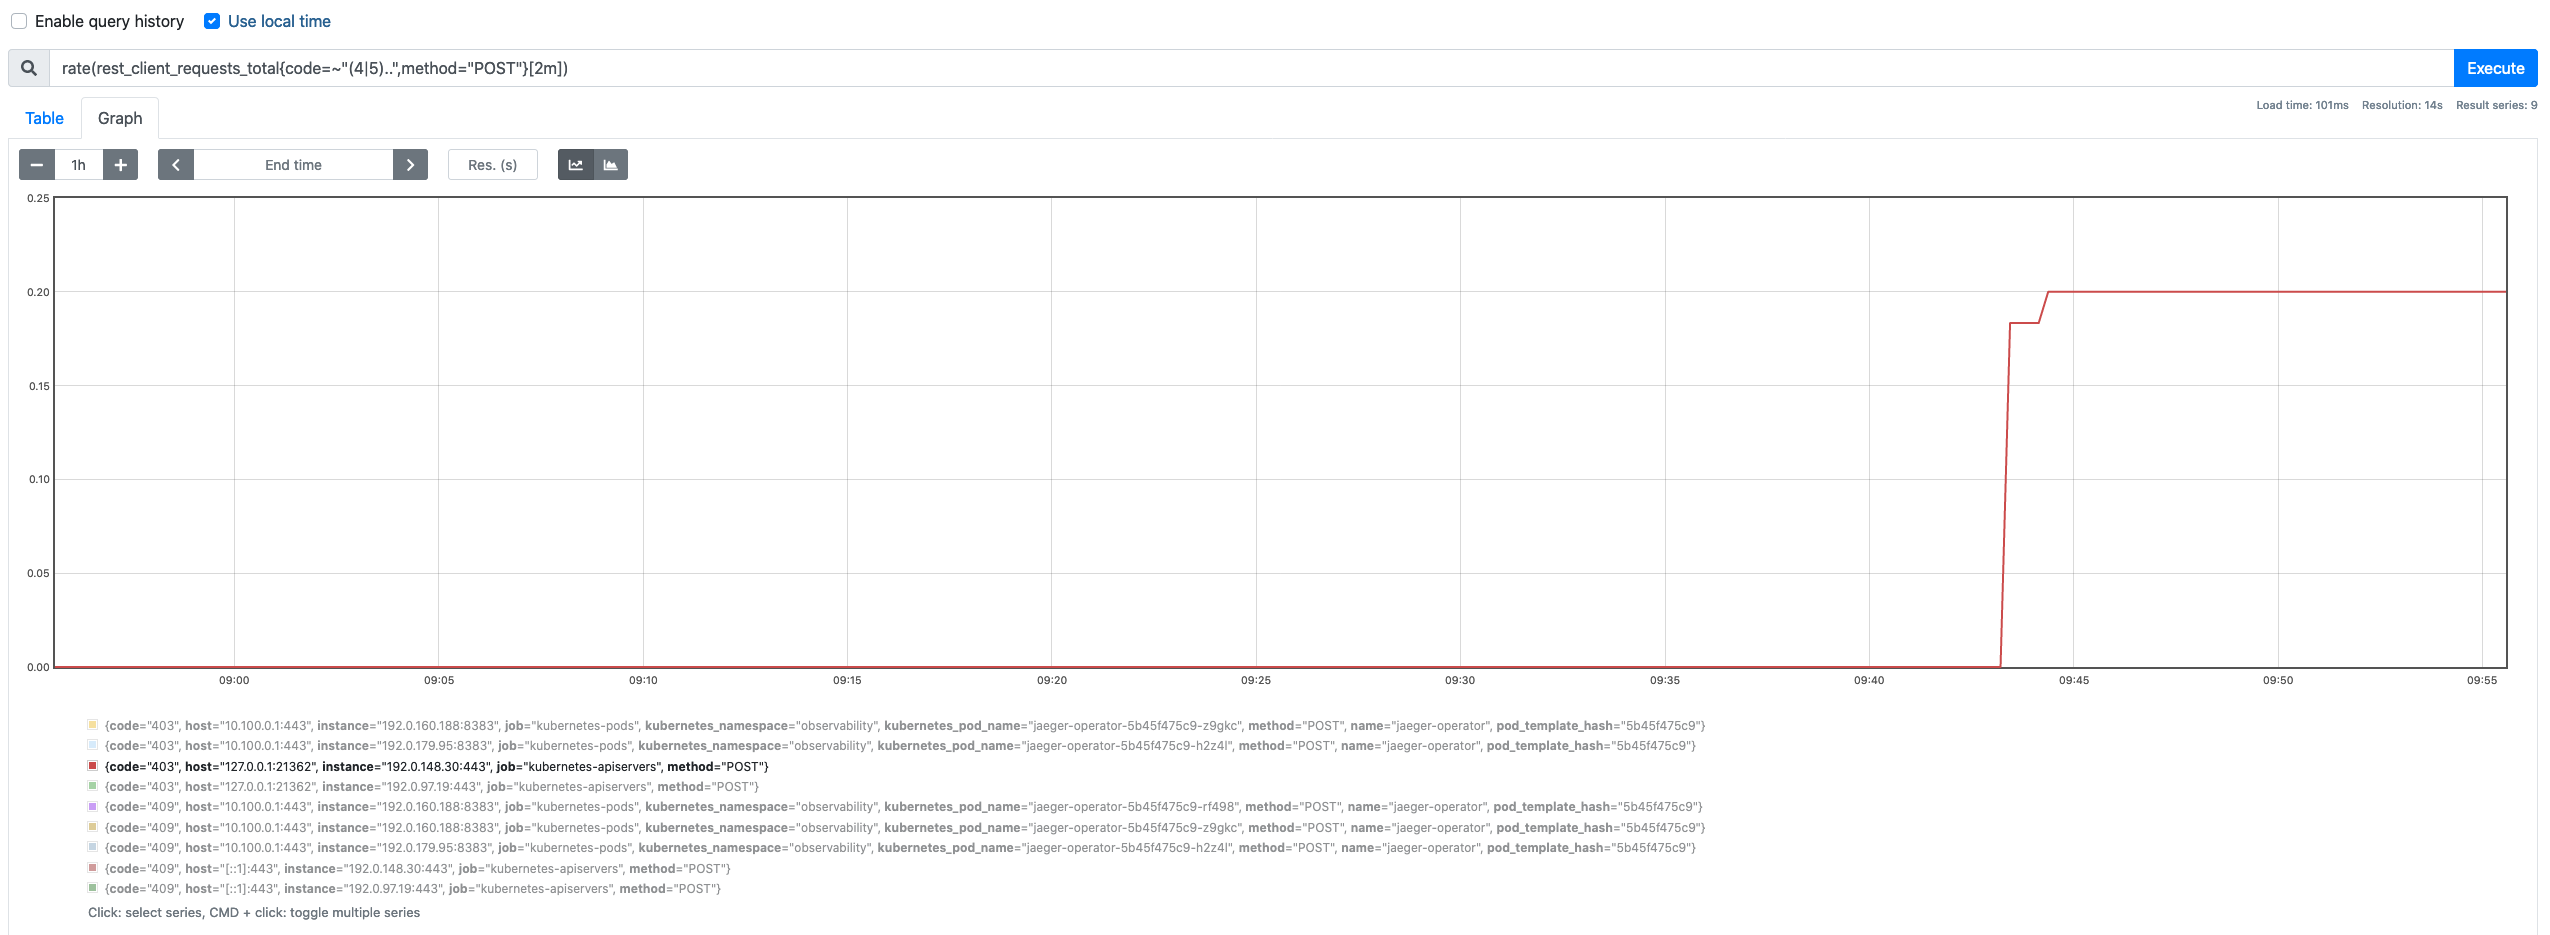
A new error did appear, I'm guessing now the oauth delegating is trying to happen and it's failing.
Same rate, 12 / 60 seconds. I can't determine the source as it's just reported as kubernetes-apiservers.
akosveres
on 15 Oct 2020
I'm not sure what's the best place to document this behavior, but the requirement behind this role is explained here:
https://www.jaegertracing.io/docs/1.20/operator/#openshift-1
I don't think you should really have this role if you don't intend to benefit from the use case it allows: having more permissions than needed isn't ideal. I don't think the risk here is big, though. If having those failures are causing trouble other than just an increase in this particular metric, I'd just ignore it.
What we could be doing to improve the situation for non-OpenShift clusters is to skip this check for vanilla Kubernetes clusters.
jpkrohling
on 15 Oct 2020
We'll silence the alerts until a fix is done. Thanks for your help.
akosveres
on 15 Oct 2020
Related issues
jpkrohling
·
7Comments
 objectiser
·
3Comments
objectiser
·
3Comments
 mumrau
·
4Comments
jpkrohling
·
3Comments
mumrau
·
4Comments
jpkrohling
·
3Comments
 get2arun
·
8Comments
get2arun
·
8Comments