For some reason JabRef 4.0 needs really long to start.
 tobiasdiez
All 9 comments
I think this is related to the telemetry stuff
 Siedlerchr
on 5 Jul 2017
Siedlerchr
on 5 Jul 2017
Yes, the telemetry is probably an influencing factor.
Other things are:
- Class loading: We've added a lot of libraries recently. Class loading takes time, especially in the beginning when a lot of classes need to be loaded to build the GUI. The only way to improve this is by reducing the amount of libraries we use. We've done this around 2 years ago, but looks like it has crept in again
- Loading of FXML files: They're nice, but they need to be loaded at some point and that likely includes startup. I have no evidence for this, but my guess is that compiled code loads faster.
 lenhard
on 11 Jul 2017
lenhard
on 11 Jul 2017
One thing I noticed: In Globals.java we should do:
JabRefExecutorService.INSTANCE.execute(() -> startTelemetryClient());
instead of starting the telemetry client directly
Siedlerchr
on 13 Jul 2017
I did some investigations.
Setting up the main table takes nearly 21 seconds. The main contribution is coming from
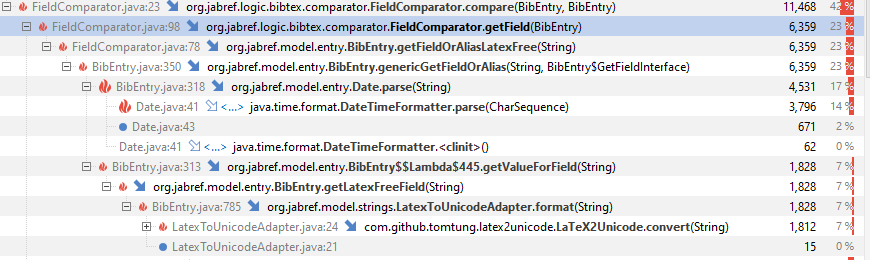
a) sorting the entries (11 secs)
b) loading the journal abbreviations for the auto completion (8 secs)
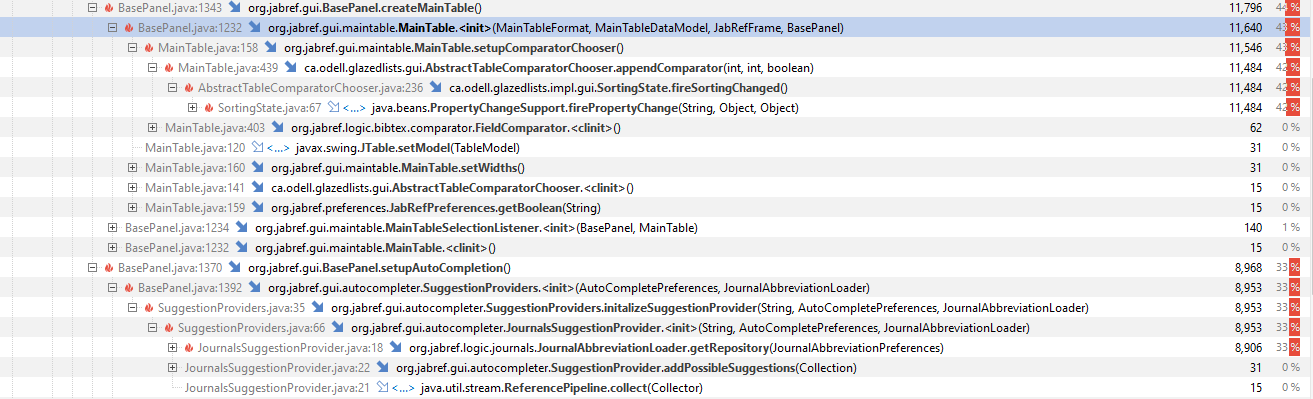
Rest rest of the interface also takes a bit of time (5 secs) but that is negligible in comparison to the above numbers. Main reason here is setting up the JavaFX stage and loading the FXML files for the group interface (2 secs) and the search bar (0.5 secs). There is not really anything we can do about it (except migrating everything to JavaFX so that not every JavaFX control needs its own stage).
What I found interesting is that all these LOGGER = getLog(....) statements take 5 seconds (can we fix this? we do not really need the option to have different loggers for different classes, right?).

Telemetry (1 sec) and our update notification (2.5 secs) take some time due to the HTTP requests but both are performed on different threads so this should do no harm.
tobiasdiez
on 13 Jul 2017
Thanks a lot for this, this makes for a much more well-founded discussion. Apart from the log issues you describe, my 5 cents are the following:
The sorting is done by the glazed lists library that we are desperately wanting to get rid of. Maybe the solution would be to migrate the main table to jabref in the nearer future.
Maybe we could also push back the loading of the journal abbreviation to the time when the auto completion first happens. Then there will be a delay in autocompletion at the beginning, but jabref will start faster.
lenhard
on 13 Jul 2017
For logging, jcabi-log could help. I really like different loggers for different classes -> convention
With jcabi-log:
Logger.debug(this, ...);
instead of
LOGGER.debug(...);
 koppor
on 13 Jul 2017
koppor
on 13 Jul 2017
I did some further investigations and it turns out that without loading a bib file approximately half of the startup time is spent for initializing the sidebar components. In particular the, open office panel as well as the general fetcher panel are relatively costly. Thus we should investigate whether it is possible to load these panels only when they are really needed.
However, the performance is quite ok right now (in particular, I don't think it worse than 3.8) and I thus remove this issue from the 4.0 milestone.
tobiasdiez
on 6 Aug 2017
since the FileUpdateMonitor also requires some resources it may be more efficient to implement this with Java Watchservices
 chochreiner
on 7 Aug 2017
chochreiner
on 7 Aug 2017
I guess we can close this for now
 LinusDietz
on 28 Dec 2017
LinusDietz
on 28 Dec 2017
Related issues
 jonasstein
·
3Comments
jonasstein
·
3Comments
 simonharrer
·
3Comments
simonharrer
·
3Comments
 humbleambition
·
3Comments
LinusDietz
·
3Comments
Siedlerchr
·
3Comments
humbleambition
·
3Comments
LinusDietz
·
3Comments
Siedlerchr
·
3Comments
Most helpful comment
I did some investigations.
Setting up the main table takes nearly 21 seconds. The main contribution is coming from


a) sorting the entries (11 secs)
b) loading the journal abbreviations for the auto completion (8 secs)
Rest rest of the interface also takes a bit of time (5 secs) but that is negligible in comparison to the above numbers. Main reason here is setting up the JavaFX stage and loading the FXML files for the group interface (2 secs) and the search bar (0.5 secs). There is not really anything we can do about it (except migrating everything to JavaFX so that not every JavaFX control needs its own stage).

What I found interesting is that all these
LOGGER = getLog(....)statements take 5 seconds (can we fix this? we do not really need the option to have different loggers for different classes, right?).Telemetry (1 sec) and our update notification (2.5 secs) take some time due to the HTTP requests but both are performed on different threads so this should do no harm.