Ipywidgets: interact + plotting with ipywidgets 6.0.0 produces many graphs or none
The following code worked for me in the previous version of ipywidgets (5.whatever-was-most-recent). By "worked" I mean it produced one plot, and dragging the slider updated that plot, with only one line shown on the plot at a time. If relevant, I'm using Chrome on OS X.
import matplotlib.pyplot as plt
%matplotlib inline
from ipywidgets import interact

def f(n):
    plt.plot([0,1,2],[0,1,n])
interact(f,n=(0,10))
I just updated to 6.0.0, cleared my browser cache, and relaunched everything. Now I get a new plot inserted vertically below the old one every time I drag the slider around.
I tried
import matplotlib.pyplot as plt
%matplotlib inline
from ipywidgets import interact

def f(n):
    plt.plot([0,1,2],[0,1,n])
interact(f,n=(0,10))
instead, and the plot does not update when the slider is dragged.
Changing %matplotlib inline to %matplotlib notebook and adding plt.clf() before the plot line sometimes works, but also sometimes just produces a blank plot when I drag the slider around.
Here's some system information; I'm happy to provide more:
╰─➤  python -c "import IPython; print(IPython.sys_info())"
{'commit_hash': '5c9c918',
 'commit_source': 'installation',
 'default_encoding': 'UTF-8',
 'ipython_path': '/Users/mglerner/anaconda3/envs/nodev_up/lib/python3.6/site-packages/IPython',
 'ipython_version': '5.1.0',
 'os_name': 'posix',
 'platform': 'Darwin-15.6.0-x86_64-i386-64bit',
 'sys_executable': '/Users/mglerner/anaconda3/envs/nodev_up/bin/python',
 'sys_platform': 'darwin',
 'sys_version': '3.6.0 |Anaconda custom (x86_64)| (default, Dec 23 2016, '
                '13:19:00) \n'
                '[GCC 4.2.1 Compatible Apple LLVM 6.0 (clang-600.0.57)]'}
In [2]: matplotlib.__version__
Out[2]: '2.0.0'
I then tried updating a few things to the conda-forge version, including matplotlib. The results of the update are below, but the update did not fix the behavior.
`╰─➤ conda update ipython matplotlib jupyter numpy -c conda-forge 1 ↵
Fetching package metadata ...............
Solving package specifications: .
Package plan for installation in environment /Users/mglerner/anaconda3/envs/nodev_up:
The following NEW packages will be INSTALLED:
blas:         1.1-openblas       conda-forge
libgfortran:  3.0.0-0            conda-forge
olefile:      0.44-py36_0        conda-forge
openblas:     0.2.19-1           conda-forge
The following packages will be UPDATED:
freetype:     2.5.5-2                        --> 2.7-1                              conda-forge
ipython:      5.1.0-py36_1                   --> 5.3.0-py36_0                       conda-forge
libpng:       1.6.27-0                       --> 1.6.28-0                           conda-forge
matplotlib:   2.0.0-np111py36_0              --> 2.0.0-np111py36_2                  conda-forge
numpy:        1.11.3-py36_0                  --> 1.11.3-py36_blas_openblas_200      conda-forge [blas_openblas]
pillow:       4.0.0-py36_0                   --> 4.0.0-py36_2                       conda-forge
scipy:        0.18.1-np111py36_1             --> 0.18.1-np111py36_blas_openblas_201 conda-forge [blas_openblas]
The following packages will be SUPERCEDED by a higher-priority channel:
jupyter:      1.0.0-py36_3                   --> 1.0.0-py36_0                       conda-forge
scikit-learn: 0.18.1-np111py36_1             --> 0.18-np111py36_blas_openblas_203   conda-forge [blas_openblas]
Proceed ([y]/n)?
`
After doing so, the behavior was unchanged.
 mglerner
All 26 comments
What version of the notebook do you have?
 jasongrout
on 2 Mar 2017
jasongrout
on 2 Mar 2017
Of all of the things to leave out of my report ...
ipywidgets 6.0.0 py36_0 conda-forge
widgetsnbextension 2.0.0 py36_0 conda-forge
notebook 4.4.1 py36_0 conda-forge
mglerner
on 2 Mar 2017
I'm able to reproduce this now. Investigating...
jasongrout
on 2 Mar 2017
Note that this does work (note that there is no need for %matplotlib inline here)
import matplotlib.pyplot as plt
from ipywidgets import interact
def f(n):
plt.plot([0,1,2],[0,1,n])
plt.show()
interact(f,n=(0,10))
(CCing @tacaswell and @SylvainCorlay as well)
jasongrout
on 2 Mar 2017
Oh, cool. Maybe I'm just out of date with my usage. The version without %matplotlib inline works for me as well.
mglerner
on 2 Mar 2017
I think this has something to do with how the matplotlib inline backend works. @tacaswell, is %matplotlib inline needed in matplotlib 2.0? Can you remind us how the inline backend works? Does it send the image to the frontend immediately, or does it wait for some reason? The way interacts work now is that they capture output sent at the time of execution, and display it.
jasongrout
on 2 Mar 2017
@mglerner - Thanks for bringing this up, though. We should note these and other things that people are liable to run into.
jasongrout
on 2 Mar 2017
Also, note that Sylvain will be updating the widget backend to mpl, letting the mpl plot be a widget just like anything else (i.e. you can live update it, arrange it with widget hbox/vbox, etc.)
jasongrout
on 2 Mar 2017
This comment seems to support the idea that the inline backend waits until a cell is finished, and then displays the figure. That won't work with the new interact - the figure needs to be displayed during the function execution (hence the explicit call to plt.show in the working example).
jasongrout
on 2 Mar 2017
Are widgets like this supposed to work with "Save Notebook with Widgets" on nbviewer? I'm having some trouble (http://nbviewer.jupyter.org/github/mglerner/MathematicalPhysics/blob/master/SimpleTests/SimpleTests.ipynb). If this question is separate enough, I'm happy to submit a different report.
mglerner
on 2 Mar 2017
@mglerner unfortunately, matplotlib figures are not really interactive widgets. We are working with the matplotlib team for it to be the case. (see e.g. the ipympl project - experimental).
 SylvainCorlay
on 2 Mar 2017
SylvainCorlay
on 2 Mar 2017
Or @mglerner you can use bqplot, which is built exactly for this. Try the pyplot API, it seems to be what you want
 dmadeka
on 2 Mar 2017
dmadeka
on 2 Mar 2017
(since bqplot plots are widgets)
dmadeka
on 2 Mar 2017
bqplot does look pretty cool. At the moment, it looks like it's tied to python 3.5, so i'll wait eagerly.
╰─➤ conda install -c conda-forge bqplot
127 ↵
Fetching package metadata ...............
Solving package specifications: .
UnsatisfiableError: The following specifications were found to be in conflict:
- bqplot -> python 3.5*
- python 3.6*
Use "conda info" to see the dependencies for each package.
mglerner
on 2 Mar 2017
Are widgets like this supposed to work with "Save Notebook with Widgets" on nbviewer? I'm having some trouble (http://nbviewer.jupyter.org/github/mglerner/MathematicalPhysics/blob/master/SimpleTests/SimpleTests.ipynb). If this question is separate enough, I'm happy to submit a different report.
This is https://github.com/ipython/ipywidgets/issues/986 - the output widget (which is displaying the matplotlib figure) is not working yet in static webpages. @SylvainCorlay - this error doesn't have anything to do with matplotlib.
jasongrout
on 2 Mar 2017
It sounds like we've solved this issue - the inline backend won't work now for interacts, but we should directly use plt.show instead, so let's close this issue and open others for other issues.
Thanks again @mglerner for reporting this!
jasongrout
on 2 Mar 2017
Thanks for the quick and excellent responses!
mglerner
on 2 Mar 2017
@mglerner, if you install bqplot via pip, it may work fine. I think it's just that the last update to the conda-forge package was before python 3.6, so a 3.6 package was never built.
jasongrout
on 2 Mar 2017
@jasongrout it installs fine, but I'm having some trouble with displaying things. Those could well be other issues on my end, though, so I'll poke more in my "free time." I know little enough about bqplot that I'd want to be really certain of myself before filing a bug report. Thanks!
mglerner
on 2 Mar 2017
@mglerner - it seems I was mistaken above - you can use %matplotlib inline, but you'll still need to explicitly show the plot. This works fine:
import matplotlib.pyplot as plt
from ipywidgets import interact
%matplotlib inline

def f(n):
    plt.plot([0,1,2],[0,1,n])
    plt.show()
interact(f,n=(0,10))
Sure enough! Not sure how I failed to test that one earlier.
mglerner
on 4 Mar 2017
@jasongrout taking your comments on https://github.com/bloomberg/bqplot/issues/449 to mean that just installing bqplot isn't quite enough at this moment. I'll happily keep waiting, knowing that you folks are doing awesome stuff. Thanks!
mglerner
on 15 Mar 2017
@mglerner interact doesn't work, because a Python callback is needed. Bqplot itself (and any JavaScript interactivity - like tooltips/points moving etc) should all work on a static webpage
dmadeka
on 15 Mar 2017
Strangely, this seems to work:
def fhn_solution(a, b, I):
    sol = odeint(f, y0=[0., 0.], t=np.linspace(0, 100, 100), args=(a, b, I))
    plt.plot(sol)
    plt.show()
but this doesn't
def fhn_solution(a, b, I):
    sol = odeint(f, y0=[0., 0.], t=np.linspace(0, 100, 100), args=(a, b, I))
    fig, ax = plt.subplots(1, 2, figsize=(12, 5))
    ax[0].plot(sol)
    fig.show()
it returns a warning:
/usr/local/lib/python3.5/dist-packages/matplotlib/figure.py:402: UserWarning: matplotlib is currently using a non-GUI backend, so cannot show the figure "matplotlib is currently using a non-GUI backend, "
 martinosorb
on 6 Jun 2017
martinosorb
on 6 Jun 2017
I'm having a similar problem, and in both cases, none of the interactive widgets show up. If there is plt.show(), then there are two plots:

But without plt.show(), there is the cryptic The installed widget Javascript is the wrong version. It must satisfy the semver range ~2.1.4. error (discussed here: https://github.com/jupyter-widgets/ipywidgets/issues/1176)
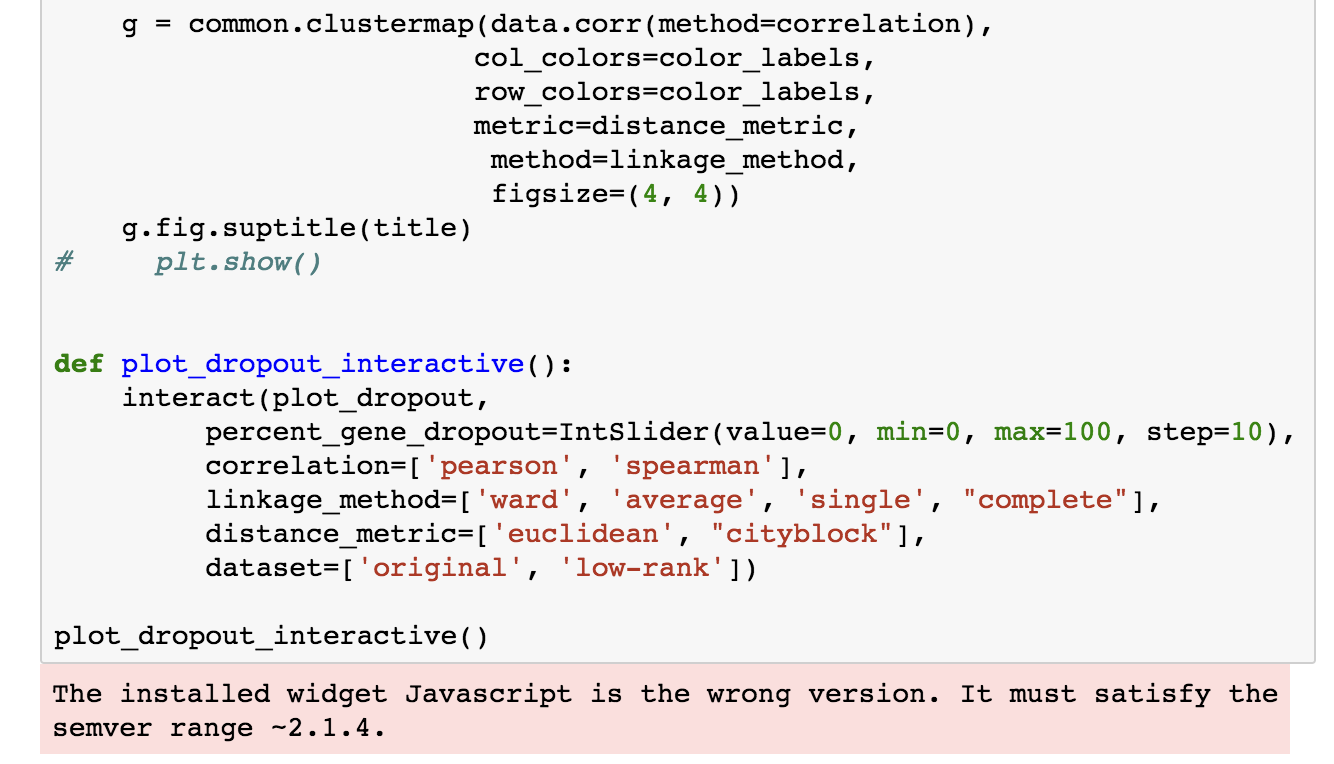
 olgabot
on 25 Jun 2017
olgabot
on 25 Jun 2017
Related issues
 aidanheerdegen
·
4Comments
aidanheerdegen
·
4Comments
 drafter250
·
4Comments
drafter250
·
4Comments
 kennethjmyers
·
3Comments
kennethjmyers
·
3Comments
 AbdealiJK
·
6Comments
AbdealiJK
·
6Comments
AbdealiJK
·
6Comments
AbdealiJK
·
6Comments
Most helpful comment
@mglerner - it seems I was mistaken above - you can use
%matplotlib inline, but you'll still need to explicitly show the plot. This works fine: