Intellij: CLion Fails to Debug `cc_binary` target on macOS
The Problem
I've written a hello world cc_binary target, but my attempts to debug it from within CLion fail.
I've created a repository, dwtj/clwb-bugs-example, to demonstrate the problem. It includes analogous CMake and Bazel builds of this program.
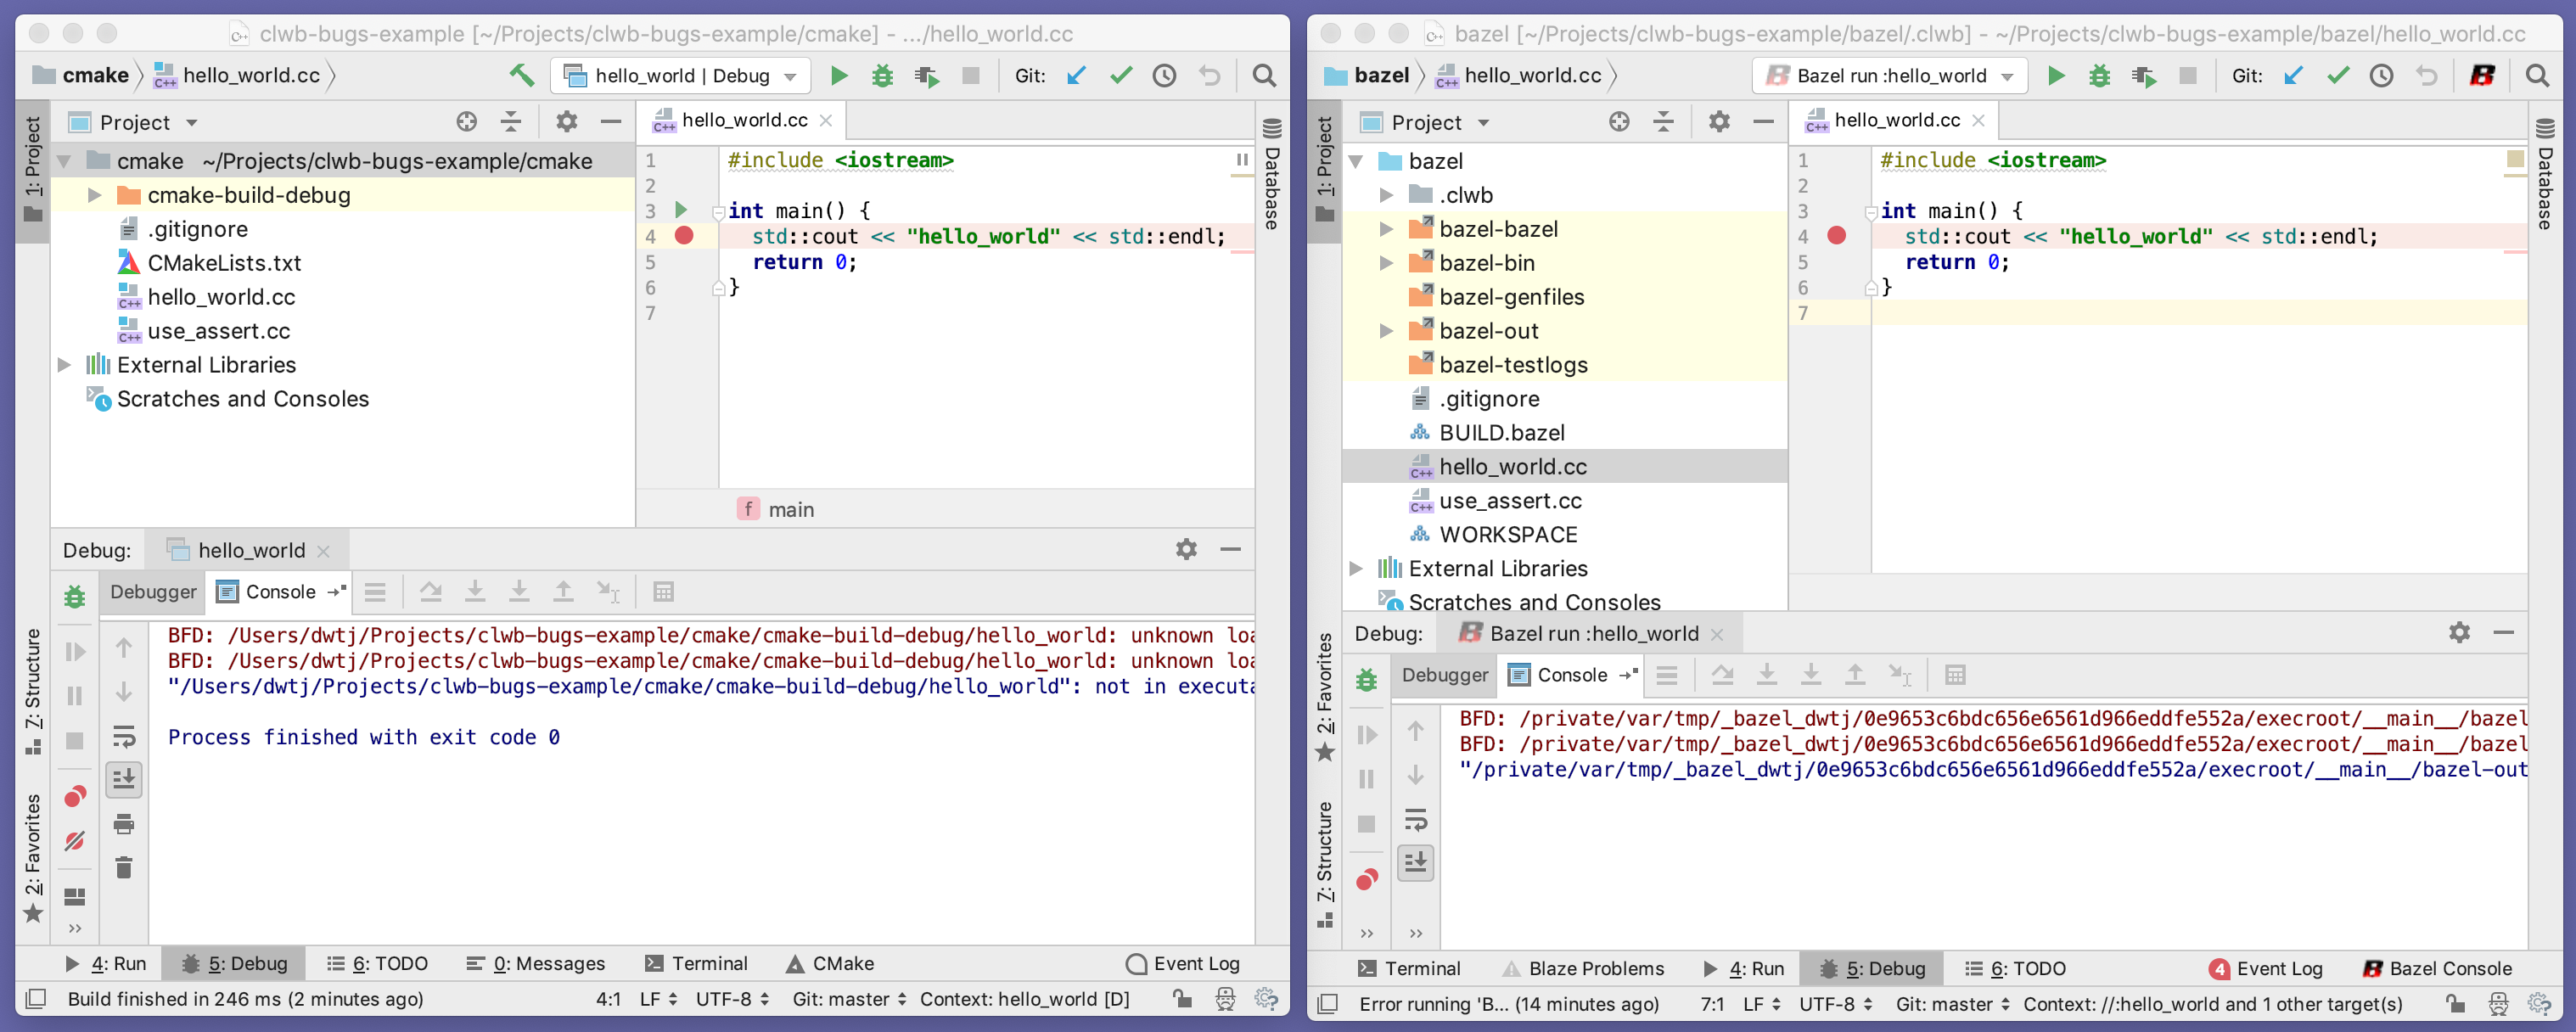
When I use CLion+CMake, I can debug hello_world just fine, but when I try to debug it with CLion+Bazel, I get a red popup error. The image below shows these two projects side-by-side:

The red popup error says:
Error running 'Bazel run :hello_world':
Debugger executable not specified Configure
Here, "Configure" is a link to CLion's "Preferences" > "Build, Execution, Deployment" > "Toolchains". Here's what that looks like for me:

There are three choices in the "Debugger" drop-down menu:
- Bundled LLDB
- Bundled GDB
- Custom GDB Executable
Note that there doesn't seem to be a "Custom LLDB" option. For varying reasons, all of these options fail in my CLion+Bazel project.
Bundled LLDB
As described above, "Bundled LLDB" seems to work fine in CLion+CMake, but it fails with the red popup error in CLion+Bazel.
Bundled GDB
When I chose this option, I get "a file format not recognized error." This happens for both CLion+CMake and CLion+Bazel.
I guess this makes sense, since my Clang/LLVM toolchain is building the program in either case, and evidently GDB won't work on a Clang-built executable. Here's the image:
Custom GDB Executable:
I don't have GCC/GDB installed on my system, so I don't have a "Custom GDB Executable" to select.
However, if I try to use /usr/bin/lldb as a Custom GDB Executable, I get an error: lldb: unrecognized option '-interpreter=mi2'. As you might expect, this happens for both CLion+CMake and CLion+Bazel. Here's the image:

My Testing Environment
- macOS 10.14.2 (Mojave)
- CLion v2018.2.7 (Though CLion v2018.3.0+ are more recent, they don't seem to
be compatible with the latest versions of the plugin.) - Two versions of the plugin,
https://github.com/bazelbuild/intellij:
- v2018.12.03.0.2 (latest pre-built release, retrieved within CLion)
0f45ef4(built from source)
- File System: APFS (Case-sensitive, Encrypted)
$ xcodebuild -version
Xcode 10.1
Build version 10B61
$ c++ --version
Apple LLVM version 10.0.0 (clang-1000.11.45.5)
Target: x86_64-apple-darwin18.2.0
Thread model: posix
InstalledDir: /Applications/Xcode.app/Contents/Developer/Toolchains/XcodeDefault.xctoolchain/usr/bin
$ bazel version
WARNING: --batch mode is deprecated. Please instead explicitly shut down your Bazel server using the command "bazel shutdown".
INFO: Invocation ID: d1b8eba4-dc65-4103-9351-c84a51b0c384
Build label: 0.21.0
Build target: bazel-out/darwin-opt/bin/src/main/java/com/google/devtools/build/lib/bazel/BazelServer_deploy.jar
Build time: Wed Dec 19 12:57:09 2018 (1545224229)
Build timestamp: 1545224229
Build timestamp as int: 1545224229
Questions
- Is it possible that my Clang/LLVM/LLDB toolchain just isn't yet supported by the plugin?
- If that is the case, how can I work around this?
- Do I need to instead use a GCC/GDB toolchain?
- If so, how should I configure my Bazel workspace, a
cc_binarytarget, and acc_librarytarget to use another toolchain? - Is this related to bazelbuild/bazel#6327? When I use CLI
lldbon my hello_world project, I see the same kind of thing in that issue. Might switching to a GCC/GDB toolchain at least let me use CLIgdbon my Bazelcc_binarytargets?
 dwtj
dwtj
All 25 comments
FYI: The above-described problem is still observed when the environment variable BAZEL_USE_CPP_ONLY_TOOLCHAIN is set, as suggested here: https://github.com/bazelbuild/intellij/issues/109#issuecomment-434722597
dwtj
on 12 Jan 2019
I am encountering the same issue with the latest versions of CLion and the Bazel plugin:
CLion version: CLion 2018.3.4
Bazel Plugin version: v2019.01.28.0.2
 brownry1986
on 26 Feb 2019
brownry1986
on 26 Feb 2019
I have the same problem. Bazel run is successful, but Debug fails. When I use the gdb which version is 7.11.1, I get an exit code 126.
 songemeng
on 22 Mar 2019
songemeng
on 22 Mar 2019
I got a solution for my situation.
- find the path of your gdb, such as
/home/username/.CLion2018.3/config/plugins/clwb/gdb/. You sudo chmod a+x gdbserver
songemeng
on 22 Mar 2019
Also encountering this issue, same symptoms.
CLion version: 2018.3.4
Bazel Plugin version: v2019.03.05.0.1
cc version: Apple LLVM version 10.0.0 (clang-1000.11.45.5)
The suggestion above to chmod a+x gdbserver did not help for me. Happy to help debug or test solutions!
 blairmatte
on 27 Mar 2019
blairmatte
on 27 Mar 2019
I am having the same issue. Is there a workaround, or work in progress to solve this issue?
 codingrhythm
on 27 May 2019
codingrhythm
on 27 May 2019
The solution from https://github.com/bazelbuild/intellij/issues/494#issuecomment-475546577 still works, you have to chmod the correct gdbserver.
$ chmod +x $HOME/.CLion2018.3/config/plugins/clwb/gdb/gdbserver
if you're using CLion 2018.3.
$ chmod +x $HOME/.CLion2019.1/config/plugins/clwb/gdb/gdbserver
if you're using CLion 2019.1.
 chaoren
on 28 May 2019
chaoren
on 28 May 2019
If you download the plugin zip directly from here, and unzip into your plugins directory, it should also work. For some reason when you install it via the IDE marketplace it doesn't preserve the permissions.
chaoren
on 28 May 2019
@chaoren This issue is specifically for macOS. I think your solution applies only for Linux. On macOS the folders you are describing do not exist. The corresponding folder on macOS appears to be $HOME/Library/Application\ Support/CLion2018.3/clwb/gdb/gdbserver. When I add execution permissions to this file there is no change to the debugging error in CLion.
blairmatte
on 28 May 2019
Yes, sorry, I only saw the last few comments on the issue. On mac we shouldn't be using the script at all.
chaoren
on 28 May 2019
@chaoren do you have an idea of what needs to be done ?
 steeve
on 4 Jun 2019
steeve
on 4 Jun 2019
I'm hoping this would fix the issue, but since I don't have access to a mac at the moment, could I ask one of you people to build and test that patch to see if it works first?
chaoren
on 4 Jun 2019
I'll take a shot, thank you!
steeve
on 4 Jun 2019
@chaoren Happy to report that it's working!
Attaching the build from the PR for other to use until it's released.
steeve
on 4 Jun 2019
Excellent. I will merge the patch shortly.
chaoren
on 4 Jun 2019
That said, debugging itself doesn't work because of https://github.com/bazelbuild/bazel/issues/6327
steeve
on 4 Jun 2019
Why was this closed? As @steeve said, debugging in CLion on macOS still doesn't work.
dwtj
on 4 Jun 2019
The issue with the bazel plugin has been fixed. The other issue is in bazel, you should follow that other bug. There's nothing actionable on this bug anymore.
chaoren
on 4 Jun 2019
Would this be fixed if we launched debugserver using the run_under flag, much like how gdbserver is used on Linux? That would then be executed in the sandbox which should still have the debug symbols intact.
 wesleyw72
on 27 Oct 2019
wesleyw72
on 27 Oct 2019
I think there's still another issue with the plugin on macOS (separate from the red popup error which seems to have been fixed, and separate from bazel issue https://github.com/bazelbuild/bazel/issues/6327).
There's a workaround discussed in bazelbuild/bazel#6327: adding --spawn_strategy=standalone. I added that to my CLion run configuration. Contrary to before, now the executable that gets generated when I click "Debug" in CLion works correctly in lldb itself (I can set and stop at breakpoints and see the source). Also, CLion will now stop and highlight the correct line if I cause an exception e.g. with return *(int*)0;. But CLion still won't stop at breakpoints.
I'm using plugin version 2019.11.14.0.1 and I also tried the patched version in https://github.com/bazelbuild/intellij/issues/494#issuecomment-498814006 above (same behavior). CLion does seem to be using LLDB because the Debug tool window includes a functioning LLDB shell.
 mikepii
on 1 Dec 2019
mikepii
on 1 Dec 2019
Please can we reopen this issue? It is definitely still broken. @chaoren
wesleyw72
on 15 Dec 2019
Please can we reopen this issue? It is definitely still broken. @chaoren
At least for Mac it is is still broken.
 cloggo
on 27 Feb 2020
cloggo
on 27 Feb 2020
I have a workaround which may be useful for others.
1) Ensure that sandboxing is disabled. This involves setting --spawn_strategy=local and rebuilding to ensure that the files necessary for debugging aren't hidden away in the sandbox.
2) Setup an .lldbinit to have an entry such as settings set target.source-map . <path_to_repo>. This enables breakpoints to be resolved correctly.
3) If using Runfiles, you may have to setup variables such as TEST_SRCDIR as they aren't setup due to lldb not being run under bazel.
wesleyw72
on 29 Apr 2020
@wesleyw72 , thank you very much.
I can confirm that the settings set target.source-map . <path_to_repo> made the magic and CLion breakpoints are finally working.
Another tip is that .lldbinit can be done in a project level as explained here
 chnlior-click
on 17 May 2020
chnlior-click
on 17 May 2020
@dwtj could you debug on macos with clion ?
i built your project < example > successfully and i could run it directly , but i can't debug it
clion just stuck on debug state and disable my breakpoints,
my environment:
xcode : 12.0
clion: v2019.3.6
bazel plugin : v2020.07.13
bazel : release 3.5.0

 CaichaoGitHub
on 29 Sep 2020
CaichaoGitHub
on 29 Sep 2020
Related issues
 brandonpollack23
·
5Comments
brandonpollack23
·
5Comments
 KaoruDev
·
4Comments
brownry1986
·
8Comments
KaoruDev
·
4Comments
brownry1986
·
8Comments
 tomrom95
·
3Comments
tomrom95
·
3Comments
 cpsauer
·
8Comments
cpsauer
·
8Comments
Most helpful comment
@chaoren Happy to report that it's working!
Attaching the build from the PR for other to use until it's released.
clwb_bazel.zip