Inquirer.js: Integration with vscode debugger
Are there any special instructions to get this to work with a debugger (in particular, Visual Studio Code)? When launching via the debugger, I don't see any console output from inquirer.prompt().
 jmjpro
All 11 comments
Chances are that VS studio doesn't have full TTY support. I don't think you'd be able to get this working outside your terminal (or until VS add full TTY support)
 SBoudrias
on 21 Feb 2018
SBoudrias
on 21 Feb 2018
And how do you debugger ? now. console.log ?
 phobal
on 19 May 2018
phobal
on 19 May 2018
I use the chrome devtool connected to the node remote debug process. This probably works similar with vs code
SBoudrias
on 20 May 2018
Ran into this as well, added "console": "integratedTerminal" to my launch configuration to change from the debugger repl to full terminal and was able to debug inquirer apps using vscode debugger.
vscode docs: https://code.visualstudio.com/docs/nodejs/nodejs-debugging#_node-console
May be worth mentioning in a FAQ or the README :)
 rajsite
on 21 Jul 2018
rajsite
on 21 Jul 2018
If anyone want to send launch.json config for the project. I'll be happy to help merge it.
SBoudrias
on 22 Jul 2018
Example of launch.json with terminal that supports tty:
{
  "version": "0.2.0",
  "configurations": [
    {
      "type": "node",
      "request": "launch",
      "name": "With TTY",
      "program": "<path to program>",
      "console": "integratedTerminal"
    }
  ]
}
This works really well for my use cases.
 sqren
on 28 Jul 2018
sqren
on 28 Jul 2018
https://tahirhassan.blogspot.com/2019/05/inquirer-debugging-in-visual-studio-code.html
add this line "console": "externalTerminal" on your "configurations"
    "version": "0.2.0",
    "configurations": [

        {
            "type": "node",
            "request": "launch",
            "name": "启动程序",
            // "program": "${workspaceFolder}/bin/test",
            "program": "${workspaceFolder}/bin/cli",
            "args": [
                "init",
                "aasas",
            ],
            "console": "externalTerminal"
        },
    ],
and prompt log will be output on externalTerminal
 yangfan0095
on 25 Oct 2019
yangfan0095
on 25 Oct 2019
@sqren Thank you so much! 👍
 3CordGuy
on 10 Jan 2020
3CordGuy
on 10 Jan 2020
I'll close the ticket as @sqren instructions appears to work properly.
Thanks!
SBoudrias
on 13 Jan 2020
I recognize this ticket was closed, but I'm a little confused about what the expected outcome from using the integrated Terminal should be.
When I am debugging using the integratedTerminal, I _am_ able to see the prompts and interact, however, in my case, I seem to have no visibility into the state of the application. It's as if the program has already exited.
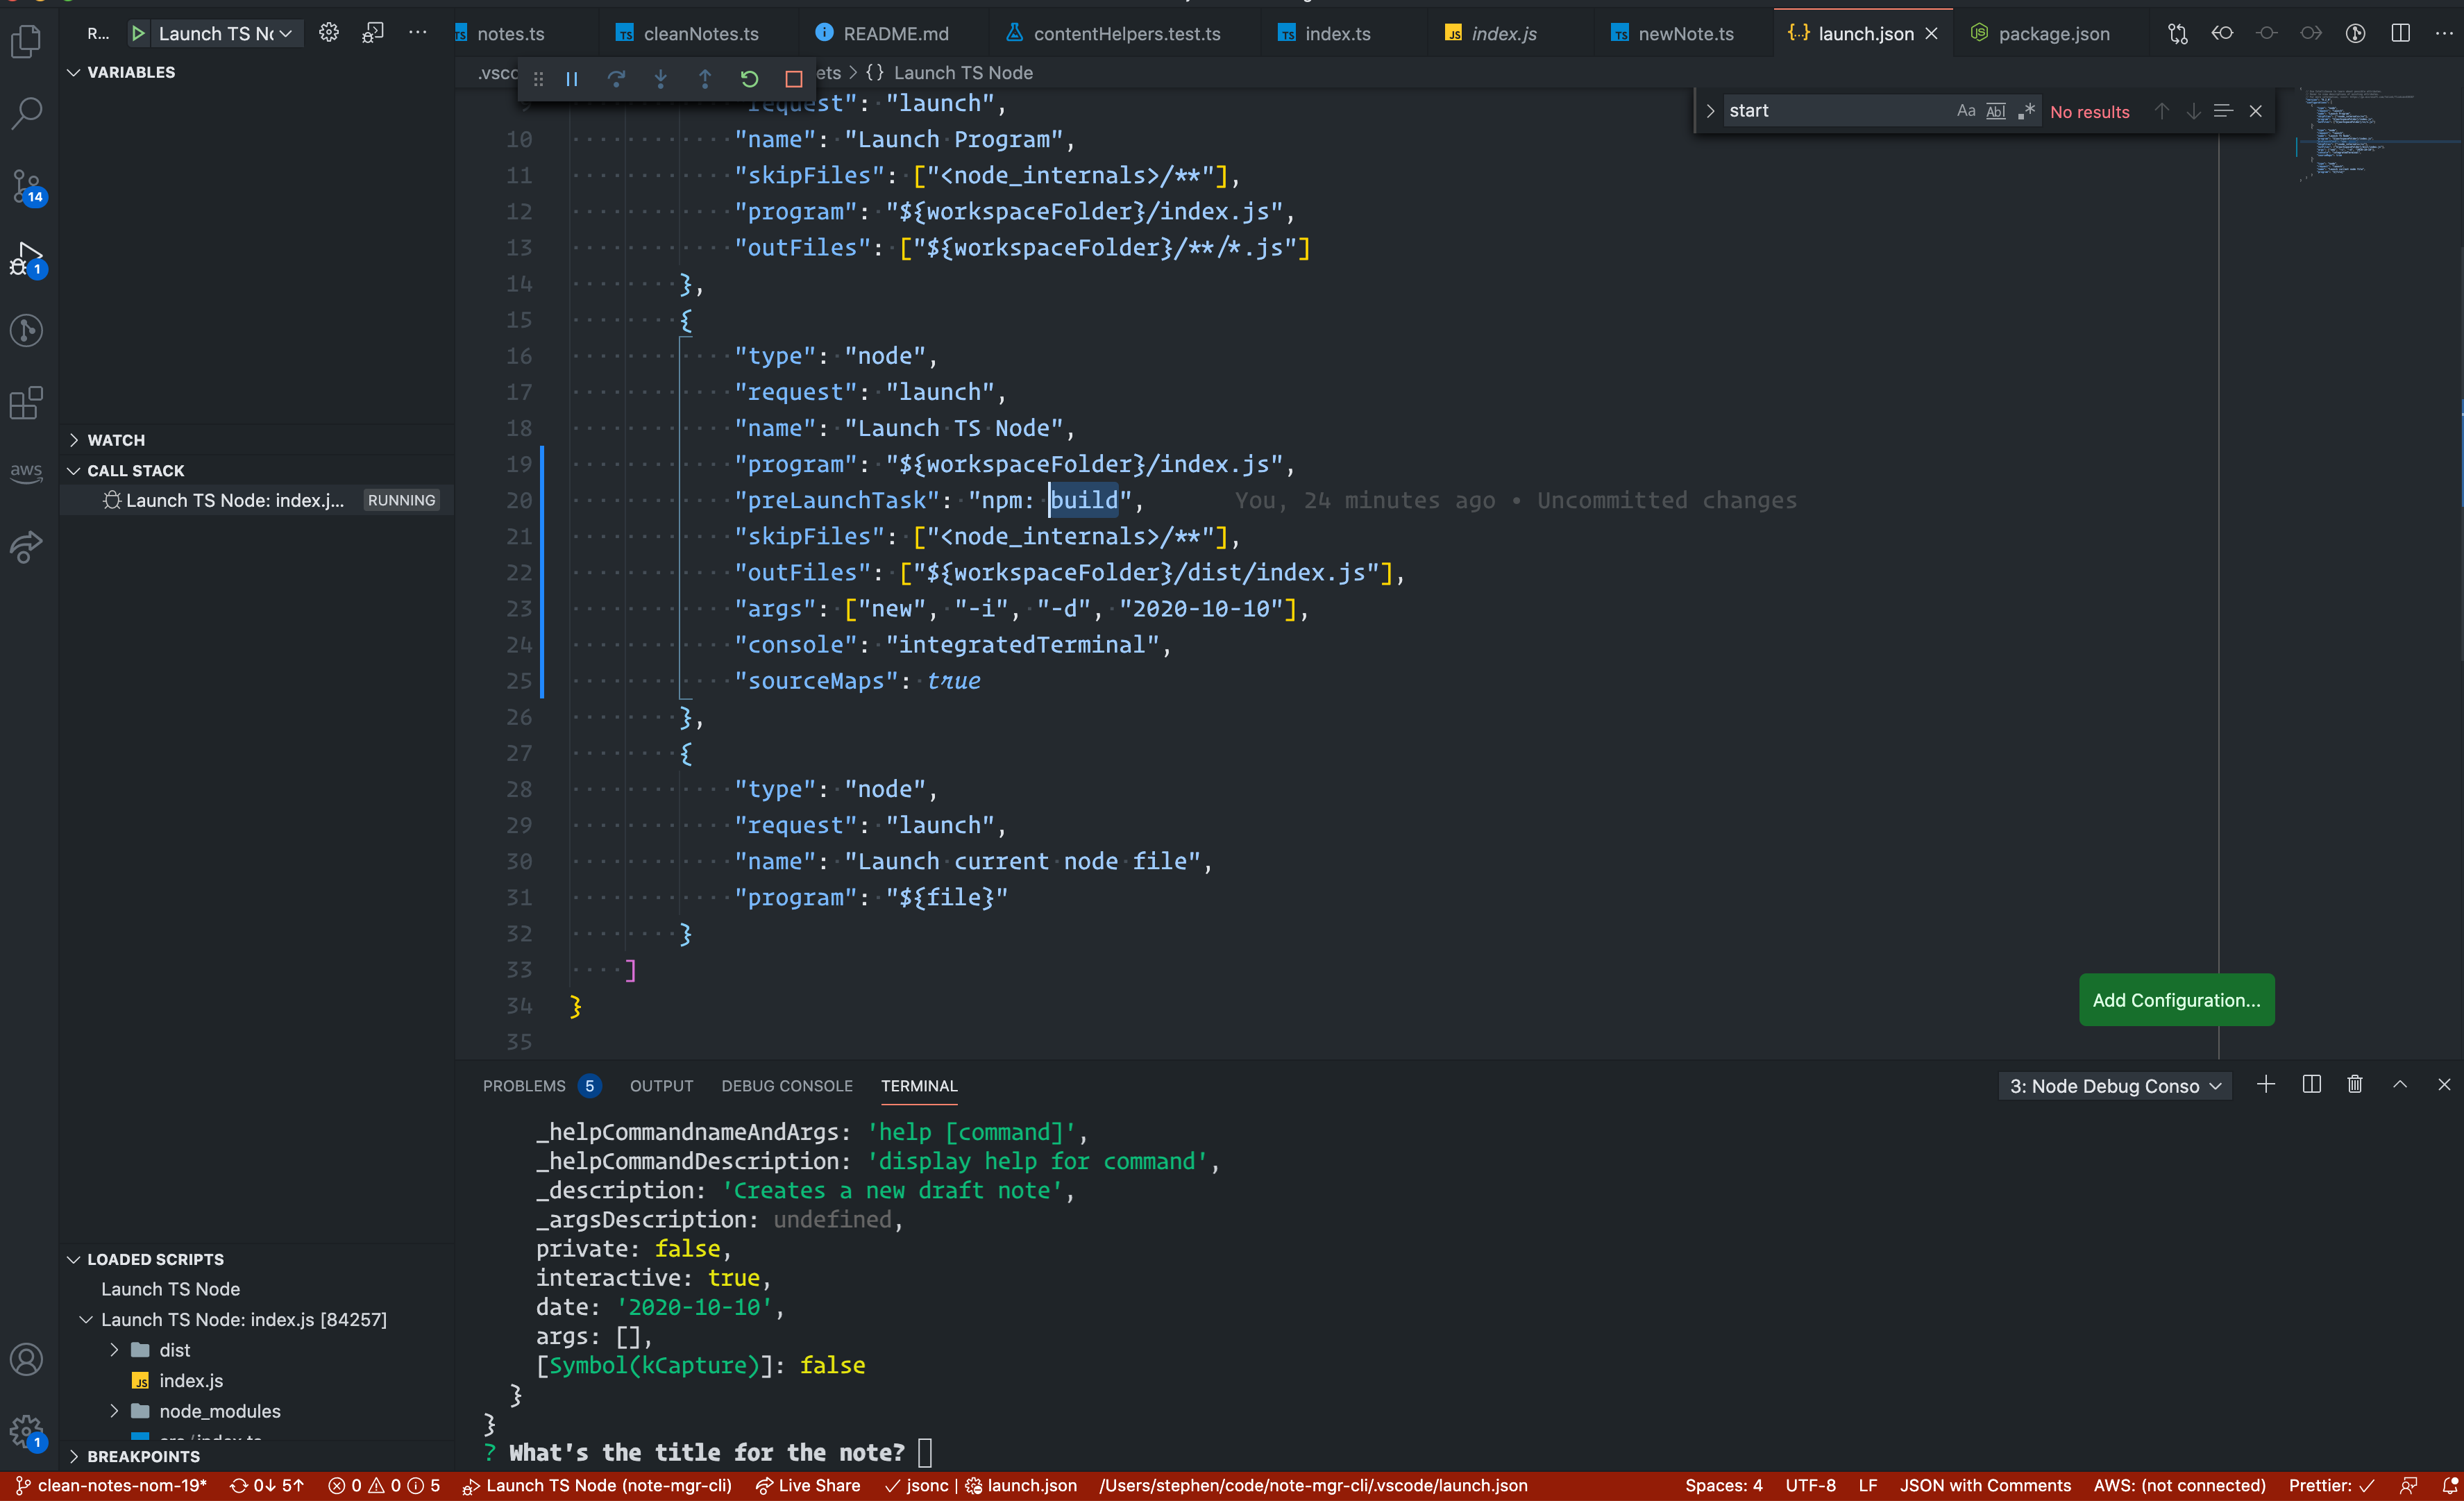
In the screen shot, you can see I have the prompt from my CLI available, the debugger has paused the process, but if you look at the left nav - there's nothing in variables, the call stack _only_ has the debugger, etc.
What am I missing? Since I'm using Inquirer in an async method, shouldn't I be able to step through and see the answers as they come _back_ from stdin?
FWIW - the question I'm currently debugging is here (summarized below):
import { prompt } from "inquirer"
import dayjs from "dayjs"
import kebabCase from "lodash.kebabcase"
import {
    ConfigurationKeys,
    DocumentStages,
    FrontmatterKeys,
    IFrontmatter,
} from "../utils"

interface ISolicitNoteMetadata {
    title?: string
    config: Map<ConfigurationKeys, any>
    options: IFrontmatter
}

export async function solicitNoteMetadata({
    title,
    config,
    options,
}: ISolicitNoteMetadata) {
    const defaultDateFmt = config.get(ConfigurationKeys.DEFAULT_DATE_FORMAT)
    const questions = [
        {
            type: "input",
            name: "title",
            message: "What's the title for the note?",
            default: options["title"] || title,
        },
        //...
    ]

    await prompt(questions).then((answers) => {
        options["title"] = answers.title
        //...
    })
}
 stephencweiss
on 11 Oct 2020
stephencweiss
on 11 Oct 2020
In case someone will be looking for Intellij WebStorm debug config. You need to enable a registry flag first as described in this ticket to capture user input in terminal. Then create normal Node.js "Run Configuration" and point it to your index.js
 oleksandr-yefremov
on 30 Nov 2020
oleksandr-yefremov
on 30 Nov 2020
Related issues
 apierzch
·
4Comments
apierzch
·
4Comments
 aydn
·
5Comments
aydn
·
5Comments
 christav
·
5Comments
christav
·
5Comments
 bapti
·
6Comments
bapti
·
6Comments
 aaronshaf
·
7Comments
aaronshaf
·
7Comments
Most helpful comment
Example of launch.json with terminal that supports tty:
This works really well for my use cases.