Ingress-nginx: Very slow response time
nginx-ingress-controller 0.9.0 beta-8 @ 10 req/s

traefik:latest @ 80 req/s
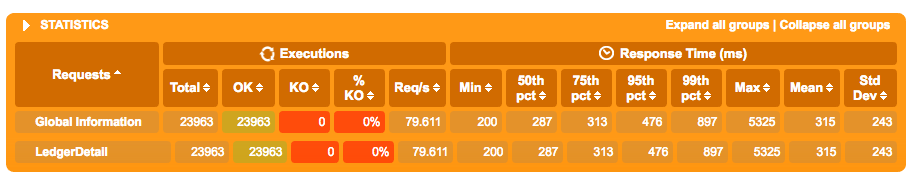
Not sure why this is but running the same service in kubernetes, traefik blows nginx ingress controller's performance out of the water. Is this a normal response curve where 90+% of requests are slower then 1.2s? Seems like something is off.
- Kubernetes 1.6.4 with weave 1.9.7 (used Kops to create the cluster)
Below is the yaml config file for nginx:
---
apiVersion: v1
kind: ServiceAccount
metadata:
  name: ingress-nginx
  namespace: kube-ingress

---
kind: ClusterRole
apiVersion: rbac.authorization.k8s.io/v1beta1
metadata:
  name: ingress-nginx
rules:
- apiGroups: ["*"]
  resources: ["*"]
  verbs: ["*"]

---
kind: ClusterRoleBinding
apiVersion: rbac.authorization.k8s.io/v1beta1
metadata:
  name: ingress-nginx
subjects:
- kind: ServiceAccount
  name: ingress-nginx
  namespace: kube-ingress
roleRef:
  apiGroup: rbac.authorization.k8s.io
  kind: ClusterRole
  name: ingress-nginx

---
kind: ConfigMap
apiVersion: v1
metadata:
  name: ingress-nginx
  namespace: kube-ingress
  labels:
    k8s-addon: ingress-nginx.addons.k8s.io
data:
  use-proxy-protocol: "true"
  server-tokens: "false"
  secure-backends: "false"
  proxy-body-size: 1m
  use-http2: "false"
  ssl-redirect: "true"

---
kind: Service
apiVersion: v1
metadata:
  name: ingress-nginx
  namespace: kube-ingress
  labels:
    k8s-addon: ingress-nginx.addons.k8s.io
  annotations:
    service.beta.kubernetes.io/aws-load-balancer-proxy-protocol: "*"
    service.beta.kubernetes.io/aws-load-balancer-cross-zone-load-balancing-enabled: "true"
spec:
  type: LoadBalancer
  selector:
    app: ingress-nginx
  ports:
  - name: http
    port: 80
    targetPort: http
  - name: https
    port: 443
    targetPort: https
---
kind: HorizontalPodAutoscaler
apiVersion: autoscaling/v2alpha1
metadata:
  name: ingress-nginx
  namespace: kube-ingress
spec:
  scaleTargetRef:
    apiVersion: apps/v1beta1
    kind: Deployment
    name: ingress-nginx
  minReplicas: 4
  maxReplicas: 20
  metrics:
  - type: Resource
    resource:
      name: cpu
      targetAverageUtilization: 50
  - type: Resource
    resource:
      name: memory
      targetAverageUtilization: 50
---
kind: Deployment
apiVersion: extensions/v1beta1
metadata:
  name: ingress-nginx
  namespace: kube-ingress
  labels:
    k8s-addon: ingress-nginx.addons.k8s.io
spec:
  replicas: 4
  template:
    metadata:
      labels:
        app: ingress-nginx
        k8s-addon: ingress-nginx.addons.k8s.io
    spec:
      terminationGracePeriodSeconds: 60
      serviceAccountName: ingress-nginx
      containers:
      - image: gcr.io/google_containers/nginx-ingress-controller:0.9.0-beta.8
        name: ingress-nginx
        imagePullPolicy: Always
        resources:
          limits:
            cpu: 300m
            memory: 300Mi
        ports:
          - name: http
            containerPort: 80
            protocol: TCP
          - name: https
            containerPort: 443
            protocol: TCP
        readinessProbe:
          httpGet:
            path: /healthz
            port: 10254
            scheme: HTTP
          initialDelaySeconds: 5
          timeoutSeconds: 5
          periodSeconds: 5
        livenessProbe:
          httpGet:
            path: /healthz
            port: 10254
            scheme: HTTP
          initialDelaySeconds: 5
          timeoutSeconds: 5
          periodSeconds: 120
        env:
          - name: POD_NAME
            valueFrom:
              fieldRef:
                fieldPath: metadata.name
          - name: POD_NAMESPACE
            valueFrom:
              fieldRef:
                fieldPath: metadata.namespace
        args:
        - /nginx-ingress-controller
        - --default-backend-service=$(POD_NAMESPACE)/nginx-default-backend
        - --configmap=$(POD_NAMESPACE)/ingress-nginx
        - --publish-service=$(POD_NAMESPACE)/ingress-nginx
 gugahoi
All 19 comments
@gugahoi what size are the nodes? how many?
Can you post information about the application you are testing ? (or repeat the test using the echoheaders image so I can replicate this)
Also please post the traefik deployment so I can use the same configuration
What application are you using to execute the test?
 aledbf
on 29 Jun 2017
aledbf
on 29 Jun 2017
Also, something to replicate the test methodology itself. I'm not seeing this performance difference at all so there must be something specific to your setup.
Thanks for testing though :)
 pieterlange
on 29 Jun 2017
pieterlange
on 29 Jun 2017
The application in question is a scala one running in a deployment with 4 pods.
The cluster has 5 masters (m4.large) and 4 nodes (m4.xlarge) and there is barely anything else on it other than kubernetes admin things (dashboard, proxy, dns, heapster, cluster autoscaler, ...)
I'll try it with echoheaders and see how it goes.
The load testing framework in use is called Gatling and I am doing a post request with Authorization header and body payload and checking for a 200 back. The application itself has been running on ECS for quite some time with no problems so I thought it would be a good candidate to test in Kubernetes.
Here is it's results in ECS with 80 req/s

traefik.yml
kind: ClusterRole
apiVersion: rbac.authorization.k8s.io/v1beta1
metadata:
  name: traefik-ingress-controller
rules:
  - apiGroups:
      - "*"
    resources:
      - "*"
    verbs:
      - "*"
---
kind: ClusterRoleBinding
apiVersion: rbac.authorization.k8s.io/v1beta1
metadata:
  name: traefik-ingress-controller
roleRef:
  apiGroup: rbac.authorization.k8s.io
  kind: ClusterRole
  name: traefik-ingress-controller
subjects:
- kind: ServiceAccount
  name: traefik-ingress-controller
  namespace: kube-system

---
apiVersion: v1
kind: ServiceAccount
metadata:
  name: traefik-ingress-controller
  namespace: kube-system

---
apiVersion: v1
kind: ConfigMap
metadata:
  name: traefik.toml-v2
  namespace: kube-system
data:
  traefik.toml: |
    # traefik.toml
    ################################################################
    # Kubernetes Ingress configuration backend
    ################################################################
    # Enable Kubernetes Ingress configuration backend
    #
    # Optional
    #
    logLevel = "INFO"
    InsecureSkipVerify = false
    defaultEntryPoints = ["http", "https"]
    [entryPoints]
      [entryPoints.http]
      address = ":80"
        [entryPoints.http.redirect]
          entryPoint = "https"
      [entryPoints.https]
      address = ":443"
        [entryPoints.https.tls]
          [[entryPoints.https.tls.certificates]]
          CertFile = "/ssl/tls.crt"
          KeyFile = "/ssl/tls.key"

    [web]
    address = ":8080"

    namespaces = ["platform-reliability"]

---
kind: Deployment
apiVersion: extensions/v1beta1
metadata:
  name: traefik-ingress-controller
  namespace: kube-system
  labels:
    k8s-app: traefik-ingress-lb
spec:
  replicas: 1
  selector:
    matchLabels:
      k8s-app: traefik-ingress-lb
  template:
    metadata:
      labels:
        k8s-app: traefik-ingress-lb
        name: traefik-ingress-lb
    spec:
      serviceAccountName: traefik-ingress-controller
      terminationGracePeriodSeconds: 60
      containers:
      - image: traefik
        name: traefik-ingress-lb
        volumeMounts:
        - name: config
          mountPath: /config
        - name: "ssl"
          mountPath: "/ssl"
        resources:
          limits:
            cpu: 200m
            memory: 30Mi
          requests:
            cpu: 100m
            memory: 20Mi
        ports:
        - containerPort: 80
        - containerPort: 443
        - containerPort: 8080
        args:
        - -d
        - --web
        - --configfile=/config/traefik.toml
        - --kubernetes
      volumes:
        - name: config
          configMap:
            name: traefik.toml-v2
        - name: ssl
          secret:
            secretName: lcf

---
apiVersion: v1
kind: Service
metadata:
  name: traefik-web-ui
  namespace: kube-system
spec:
  selector:
    k8s-app: traefik-ingress-lb
  ports:
  - port: 80
    targetPort: 8080

---
apiVersion: v1
kind: Service
metadata:
  namespace: kube-system
  name: traefik
  labels:
    k8s-app: traefik-ingress-lb
spec:
  selector:
    k8s-app: traefik-ingress-lb
  ports:
    - port: 80
      name: http
    - port: 443
      name: https
  type: LoadBalancer
Some more Results with echoheaders this time using vegeta
YAML files are here
Traefik
❯ echo "GET http://echoheaders-traefik.kubernetes.XXX.com" | vegeta attack -duration=10s | tee results.bin | vegeta report
Requests      [total, rate]            500, 50.10
Duration      [total, attack, wait]    10.011283016s, 9.979999907s, 31.283109ms
Latencies     [mean, 50, 95, 99, max]  32.130573ms, 25.929882ms, 59.900347ms, 127.20284ms, 182.735508ms
Bytes In      [total, mean]            286500, 573.00
Bytes Out     [total, mean]            0, 0.00
Success       [ratio]                  100.00%
Status Codes  [code:count]             200:500
Error Set:
Nginx
❯ echo "GET http://echoheaders-nginx.kubernetes.XXX.com" | vegeta attack -duration=10s | tee results.bin | vegeta report
Requests      [total, rate]            500, 50.10
Duration      [total, attack, wait]    10.004602514s, 9.979999867s, 24.602647ms
Latencies     [mean, 50, 95, 99, max]  53.169396ms, 29.292396ms, 154.024096ms, 523.979827ms, 728.28032ms
Bytes In      [total, mean]            296010, 592.02
Bytes Out     [total, mean]            0, 0.00
Success       [ratio]                  99.00%
Status Codes  [code:count]             200:495  0:5
Error Set:
Get http://echoheaders-nginx.kubernetes.XXX.com: http: server closed idle connection
Get http://echoheaders-nginx.kubernetes.XXX.com: EOF
Traefik pretty consistently gives me a 100% success rate whereas NGINX never does. The response curve for the nginx ingress controller is also considerably worse in all percentiles.
gugahoi
on 30 Jun 2017
More tests with goad using the same yaml files from above and I've updated the gist to include both goad.ini files used in testing :
Traefik
Regional results

Region: us-east-1
   TotReqs   TotBytes    AvgTime   AvgReq/s  AvgKbps/s
       500     319 kB     0.216s      21.73   13880.21
   Slowest    Fastest   Timeouts  TotErrors
    0.583s     0.206s          0          0
Region: ap-southeast-2
   TotReqs   TotBytes    AvgTime   AvgReq/s  AvgKbps/s
       500     320 kB     0.013s     371.57  237411.83
   Slowest    Fastest   Timeouts  TotErrors
    0.337s     0.002s          0          0

Overall

   TotReqs   TotBytes    AvgTime   AvgReq/s  AvgKbps/s
      1000     639 kB     0.115s     393.30  251292.03
   Slowest    Fastest   Timeouts  TotErrors
    0.583s     0.002s          0          0
HTTPStatus   Requests
       200       1000
NGINX
Regional results

Region: ap-southeast-2
   TotReqs   TotBytes    AvgTime   AvgReq/s  AvgKbps/s
       500     320 kB     0.004s    1255.35  802168.94
   Slowest    Fastest   Timeouts  TotErrors
    0.011s     0.003s          0          0
Region: us-east-1
   TotReqs   TotBytes    AvgTime   AvgReq/s  AvgKbps/s
       500     303 kB     0.227s      20.27   12950.19
   Slowest    Fastest   Timeouts  TotErrors
    0.620s     0.207s          0         26

Overall

   TotReqs   TotBytes    AvgTime   AvgReq/s  AvgKbps/s
      1000     622 kB     0.113s    1275.62  815119.12
   Slowest    Fastest   Timeouts  TotErrors
    0.620s     0.003s          0         26
HTTPStatus   Requests
       200        974
Interestingly with goad and using only my local region (ap-southeast-2), nginx works great but the second I add another region I seem to consistently get errors with NGINX but never with Traefik.
gugahoi
on 30 Jun 2017
Create a cluster using kops in us-west
export MASTER_ZONES=us-west-2a
export WORKER_ZONES=us-west-2a,us-west-2b
export KOPS_STATE_STORE=s3://k8s-xxxxxx-01
export AWS_DEFAULT_REGION=us-west-2

kops create cluster \
 --name uswest2-01.xxxxxxx.io \
 --cloud aws \
 --master-zones $MASTER_ZONES \
 --node-count 2 \
 --zones $WORKER_ZONES \
 --master-size m3.medium \
 --node-size m4.large \
 --ssh-public-key ~/.ssh/id_rsa.pub \
 --image coreos.com/CoreOS-stable-1409.5.0-hvm \
 --yes
Create the echoheaders deployment
echo "
apiVersion: v1
kind: Service
metadata:
  name: echoheaders
  labels:
    app: echoheaders
spec:
  type: NodePort
  ports:
  - port: 80
    targetPort: 8080
    protocol: TCP
    name: http
  selector:
    app: echoheaders

---

apiVersion: extensions/v1beta1
kind: Deployment
metadata:
  name: echoheaders
spec:
  replicas: 1
  template:
    metadata:
      labels:
        app: echoheaders
    spec:
      containers:
      - name: echoheaders
        image: gcr.io/google_containers/echoserver:1.4
        ports:
        - containerPort: 8080

---

apiVersion: extensions/v1beta1
kind: Ingress
metadata:
  name: echoheaders-nginx
  annotations:
    kubernetes.io/ingress.class: nginx
spec:
  rules:
  - host: echoheaders.uswest2-01.xxxxx-xxxx.io
    http:
      paths:
      - backend:
          serviceName: echoheaders
          servicePort: 80
" | kubectl create -f -
Create the nginx ingress controller
$ kubectl create -f https://gist.githubusercontent.com/gugahoi/9f6fbb497899a1a4bca0973be0aad88d/raw/e5943bd71b1b36a68f7f44b7058e3c8f5d3938ab/nginx.yml
Run the tests*
$ echo "GET http://echoheaders.uswest2-01.xxxxxxxx.io" | vegeta attack -duration=10s | tee results.bin | vegeta report
Requests      [total, rate]            500, 50.10
Duration      [total, attack, wait]    10.166760623s, 9.979999939s, 186.760684ms
Latencies     [mean, 50, 95, 99, max]  195.616624ms, 184.568905ms, 263.178239ms, 392.353651ms, 496.3604ms
Bytes In      [total, mean]            283000, 566.00
Bytes Out     [total, mean]            0, 0.00
Success       [ratio]                  100.00%
Status Codes  [code:count]             200:500
Error Set:
$ echo "GET http://echoheaders.uswest2-01.xxxxxxxx.io" | vegeta attack -duration=10s | tee results.bin | vegeta report
Requests      [total, rate]            500, 50.10
Duration      [total, attack, wait]    10.166276105s, 9.979999857s, 186.276248ms
Latencies     [mean, 50, 95, 99, max]  215.832082ms, 187.310956ms, 376.512348ms, 441.538481ms, 618.168085ms
Bytes In      [total, mean]            283000, 566.00
Bytes Out     [total, mean]            0, 0.00
Success       [ratio]                  100.00%
Status Codes  [code:count]             200:500
Error Set:
$ kubectl scale deployment echoheaders --replicas=2
deployment "echoheaders" scaled
$ echo "GET http://echoheaders.uswest2-01.xxxxxxxx.io" | vegeta attack -duration=10s | tee results.bin | vegeta report
Requests      [total, rate]            500, 50.10
Duration      [total, attack, wait]    10.161263296s, 9.979999715s, 181.263581ms
Latencies     [mean, 50, 95, 99, max]  212.086374ms, 190.977764ms, 375.135607ms, 549.585284ms, 705.742581ms
Bytes In      [total, mean]            283000, 566.00
Bytes Out     [total, mean]            0, 0.00
Success       [ratio]                  100.00%
Status Codes  [code:count]             200:500
Error Set:
Delete the cluster
kops delete cluster --name uswest2-01.xxxxxxxx.io --yes
Important:
- The sizes of the nodes are smaller than yours
- m4.xlarge provides 4 vCPUs vs 2 in m4.large (this affects the number of nginx workers)
- Keep in mind that I'm running vegeta from Chile ;)
aledbf
on 30 Jun 2017
@gugahoi not sure we can blame nginx for the behavior you see in your tests.
aledbf
on 30 Jun 2017
@aledbf Thanks for this, might well be another component in the cluster but seems a little coincidental to me. What version of kops did you use?
gugahoi
on 30 Jun 2017
$ kops version
Version 1.6.2 (git-98ae12a)
@aledbf Do you know what CNI you're using? Weave? Flannel?
 treacher
on 30 Jun 2017
treacher
on 30 Jun 2017
@treacher the default is kubenet
aledbf
on 30 Jun 2017
I wonder if it is related to weave or another component we have in the cluster. It is still odd to me that Traefik doesnt have these problems tho.
gugahoi
on 30 Jun 2017
@gugahoi can we close this issue?
aledbf
on 30 Jun 2017
Closing. Please reopen if you have more questions or information about your tests
aledbf
on 30 Jun 2017
Just an update on this, we have found that there was a problem with weave registering/unregistering IP addresses for nodes when scaling (both up and down) which meant traffic was being routed to nodes that didnt exist any longer which lead to the timeouts and poor performance. I am not sure why Traefik didn't suffer the same issues however with flannel I have not been able to observe these problems and nginx-ingress-controller has been working very well.
gugahoi
on 15 Aug 2017
@gugahoi thank you for the update!
aledbf
on 15 Aug 2017
I'm experiencing this same slow response time problem. I'm running on a GKE cluster and I get the same issue on 1.8.5-gke.0 and 1.7.11-gke.1.
I install the latest ingress-nginx from the helm chart (nginx-ingress-0.8.13). On the endpoint I'm testing, I'm getting response times of 1200ms, however if I install flannel, using kubectl apply -f https://raw.githubusercontent.com/coreos/flannel/master/Documentation/kube-flannel.yml, response times immediately improve to 300ms.
The only problem is, Heapster then suddenly becomes unable to get resource metrics for pods not running on the same node as the heapster container. I assume, this is due to some networking policy change due to flannel, so far I haven't been able to figure out a solution.
 michailbrynard
on 27 Jan 2018
michailbrynard
on 27 Jan 2018
@gugahoi how did you get metrics on your screens? what tool did you use? thanks
 ramilexe
on 18 Nov 2019
ramilexe
on 18 Nov 2019
@ramilexe Gatling https://gatling.io/
 r1cebank
on 5 Dec 2019
r1cebank
on 5 Dec 2019
Related issues
 sophaskins
·
3Comments
sophaskins
·
3Comments
 vdavidoff
·
3Comments
vdavidoff
·
3Comments
 juliohm1978
·
3Comments
juliohm1978
·
3Comments
 briananstett
·
3Comments
briananstett
·
3Comments
 cehoffman
·
3Comments
cehoffman
·
3Comments
Most helpful comment
Just an update on this, we have found that there was a problem with weave registering/unregistering IP addresses for nodes when scaling (both up and down) which meant traffic was being routed to nodes that didnt exist any longer which lead to the timeouts and poor performance. I am not sure why Traefik didn't suffer the same issues however with flannel I have not been able to observe these problems and nginx-ingress-controller has been working very well.