Influxdb: [Bug] Constantly Increasing Average Query duration
__System info:__ [Include InfluxDB version, operating system name, and other relevant details]
OS: Amazon Linux AMI
InfluxDB version : 1.3.7
__Steps to reproduce:__
- I've configured influxDB input in telegraf collector which runs on InfluxDB host.
- I've created a dashboard in Grafana which displays InfluxDB internal metrics (Active queries, average query duration and many more).
I've noticed that the average query duration is constantly increasing and reaches extremely high number (~1707 minutes).
This number decreases only after mongoDB service restart.
Why does mongo queries reaches these numbers ?
How can I fix it to keep a steady & low average query duration ?
 dudusakharovich
All 9 comments
Can you give us some more details about what kind of queries you are running and confirm that you're talking about InfluxDB and not MongoDB?
 jsternberg
on 1 Nov 2017
jsternberg
on 1 Nov 2017
@jsternberg - I'm using standard queries, which all are coming from Grafana (InfluxDB is configured as data source).
All the queries are basic select from measurements and displaying on time series graph.
dudusakharovich
on 1 Nov 2017
@jsternberg - Hey, any update regarding this issue ? The average query duration is still increasing.
Only restart to the InfluxDB service solves it.
dudusakharovich
on 5 Nov 2017
We need to know the types of queries you are running. The data can be anonymized, but the number of series, shards, and the type of query can help us figure out what's going on. Can you give me the output of SHOW SHARDS for the database you are querying?
jsternberg
on 6 Nov 2017
@jsternberg - Sure, I've uploaded an image with the output.
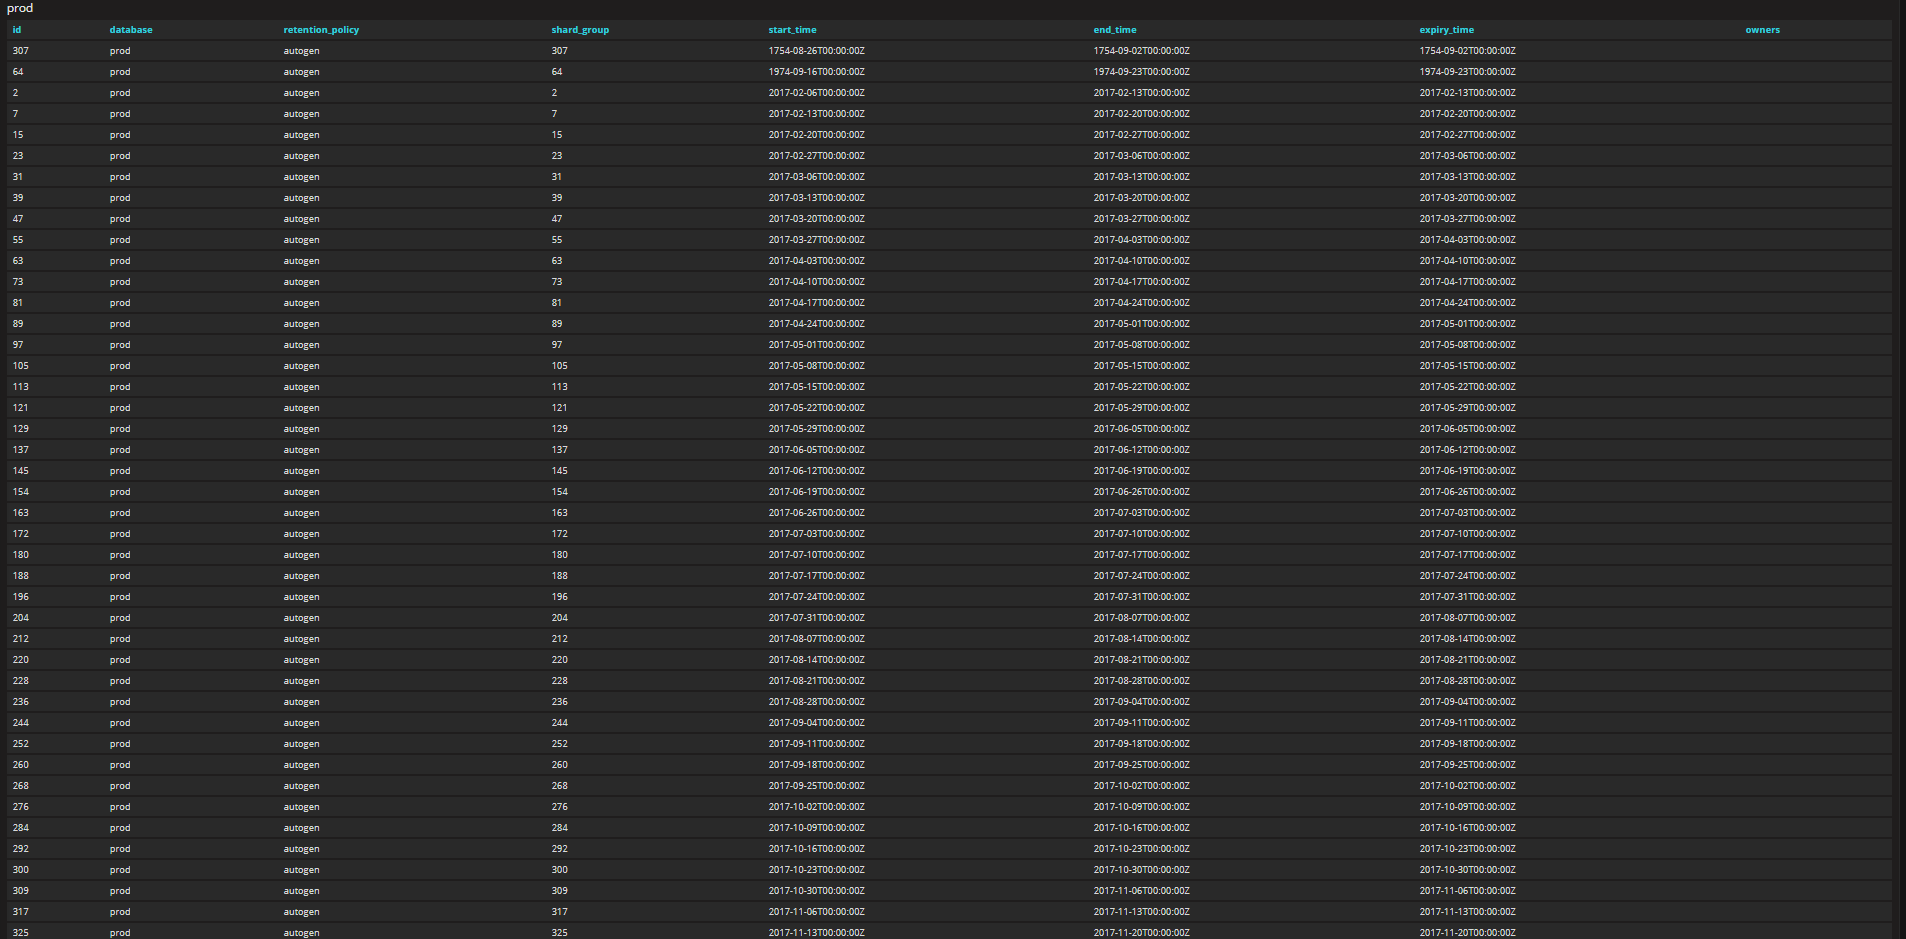
dudusakharovich
on 14 Nov 2017
@jsternberg - Any insights ?
dudusakharovich
on 22 Nov 2017
Just thought I'd leave a note here since I thought I had a similar problem. Could the right answer be that queryDurationNs is cumulative? That is, if you divide it by queriesFinished you get the number you are looking for. I'm not sure this is how it works but this way the values make sense for me.
 lennardk
on 10 Mar 2018
lennardk
on 10 Mar 2018
Due source code query/executor.go:
statQueryExecutionDuration = "queryDurationNs" // Total (wall) time spent executing queries.
queryDurationNs is total (wall) time spent executing queries. It will increased with running instance.
In your dashboard, you should use derivative (1s).
 alswl
on 23 Mar 2018
alswl
on 23 Mar 2018
I think this issue may be resolved by community contributions. Thank you everyone.
Yes, the query duration reported in internal is the wall time and you should use derivative or difference to check the change. If I have misinterpreted the original issue, please tell me and I'll reopen this issue. Thanks.
jsternberg
on 29 Mar 2018
Related issues
 airyland
·
3Comments
airyland
·
3Comments
 ricco24
·
3Comments
ricco24
·
3Comments
 allenbunny
·
3Comments
allenbunny
·
3Comments
 binary0111
·
3Comments
binary0111
·
3Comments
 Raniz85
·
3Comments
Raniz85
·
3Comments
Most helpful comment
Due source code
query/executor.go:queryDurationNsis total (wall) time spent executing queries. It will increased with running instance.In your dashboard, you should use
derivative (1s).