Influxdb: Influx 1.3 Error 500's until restart
Bug report
__System info:__ Docker 17.03.1-ce running influxdb:1.3.0-alpine image Running on ubuntu 16.04 4.4.0-1016-aws
__Steps to reproduce:__
- Upgraded from influxdb:1.2.2-alpine to influxdb:1.3.0-alpine
- 13.5 hours later, all requests to one of my DB's resulted in error 500's
[httpd] 10.0.4.150,127.0.0.1 - service_metrics [27/Jun/2017:21:55:18 +0000] "POST /write?db=service_metrics&precision=m HTTP/1.1" 500 20 "-" "Java/1.8.0_121" 4f4cc532-5b83-11e7-a286-000000000000 10000613
[httpd] 10.0.1.119,127.0.0.1 - service_metrics [27/Jun/2017:21:55:19 +0000] "POST /write?db=service_metrics&precision=m HTTP/1.1" 500 20 "-" "Java/1.8.0_121" 4f94e3a0-5b83-11e7-a287-000000000000 10000497
[httpd] 10.0.1.219,127.0.0.1 - service_metrics [27/Jun/2017:21:55:19 +0000] "POST /write?db=service_metrics&precision=m HTTP/1.1" 500 20 "-" "Java/1.8.0_121" 4faba389-5b83-11e7-a288-000000000000 10001075
[httpd] 10.0.5.183,127.0.0.1 - service_metrics [27/Jun/2017:21:55:20 +0000] "POST /write?db=service_metrics&precision=m HTTP/1.1" 500 20 "-" "Java/1.8.0_121" 501a40c6-5b83-11e7-a289-000000000000 10000612
All other DB's continued to work. Nothing else was logged before or after the error 500's as the the cause of the issues
- Restarted the container to restore everything to working behavior
__Expected behavior:__ If it starts throwing error 500's should likely have other logging to track down the root issue
__Actual behavior:__ throwning error 500's on every request
__Additional info:__ Influx config: https://gist.github.com/rhuddleston/49b6a25d7252b3ebd807dc9174d8d65d
I will attach debug information the next time this occurs. Opening it now as it seems to relate to upgrading to influxDB 1.3 and incase others see similar issues.
 rhuddleston
All 39 comments
With those response times in your log entries, this smells like #8500
 phemmer
on 29 Jun 2017
phemmer
on 29 Jun 2017
We are experiencing the exact same issue after upgrade to 1.3.0 from 1.2.1. The requests fail with {"error":"timeout"}.
There are no CQs defined.
 kostko
on 29 Jun 2017
kostko
on 29 Jun 2017
@rhuddleston thanks for the report. Could you possibly switch on one configuration option in the [data] section? Specifically trace-logging-enabled = true.
Further, could you provide more information:
- on your general write/query load? How many writes per second roughly? Tens, hundreds, thousands?
- Are you continually querying the database that's returning the 500s?
- Do you have any of the JSON response bodies to the 500 errors, e.g., @kostko mentioned they're seeing
{"error":"timeout"}.
Finally, when it next happens it would be useful to get some profiles of the system. Wait until it's happened again, keep the system running for a little while once it starts happening (if possible) and then run the following:
curl -o profiles.tar.gz "http://localhost:8086/debug/pprof/all"
or, if you have access to your server from a browser then you can just put http://localhost:8086/debug/pprof/all in and the profiles will be downloaded.
 e-dard
on 29 Jun 2017
e-dard
on 29 Jun 2017
I'm actually seeing a similar issue after running influxdb for 14 hours. I will create a new bug report.
 antonioaguilar
on 10 Jul 2017
antonioaguilar
on 10 Jul 2017
@antonioaguilar Any reason to believe it's not a duplicate of this, or #8500?
phemmer
on 10 Jul 2017
@phemmer I don't think it's the same issue as in #8500. In my case, my InfluxDB instance is still responsive, e.g. I can access the server and perform queries vi the CLI. I just can't post any data to it anymore via my client or curl.
antonioaguilar
on 10 Jul 2017
Can you test with the current nightly or a build off of the 1.3 branch? This issue sounds similar to #8500 which should be resolved with recent fixes.
 jwilder
on 11 Jul 2017
jwilder
on 11 Jul 2017
It happened again today. I went ahead and upgraded to 1.3.1 and will let you know if the issue occurs again.
@e-dard tens of writes per second, we are not continually querying the DB
I tried hitting /debug/pprof/all but after 5 minutes and no data I gave up and killed it. Same with /debug/vars, neither would return when in this state
rhuddleston
on 2 Aug 2017
@jwilder I'm having the same issue with v1.4.0~n201710130800. Any request seems to result in a timeout or just no reply (I tried show measurements and writes).
This issue is permanent and not solved until restart. The issue occurs after >= 10 hours of continuous insertion on a single node. The batches are <= 86400 points/request.
Requesting /debug/pprof/all results in no data being sent over the http connection. I quit my curl -o profiles.tar.gz "http://localhost:8086/debug/pprof/all" after 16 minutes.
I enabled tracelogging for you, but it doesn't reveal anything interesting, just compacts:
Oct 15 11:08:35 db influxd[14169]: [I] 2017-10-15T09:08:34Z compact id=896 (0/0) (0/0) (0/0) (0/0) engine=tsm1
Oct 15 11:08:35 db influxd[14169]: [I] 2017-10-15T09:08:34Z compact id=1068 (0/0) (0/0) (0/0) (0/0) engine=tsm1
Oct 15 11:08:35 db influxd[14169]: [I] 2017-10-15T09:08:34Z compact id=860 (0/0) (0/0) (0/0) (0/0) engine=tsm1
Oct 15 11:08:35 db influxd[14169]: [I] 2017-10-15T09:08:34Z compact id=826 (0/0) (0/0) (0/0) (0/0) engine=tsm1
Oct 15 11:08:35 db influxd[14169]: [I] 2017-10-15T09:08:34Z compact id=949 (0/0) (0/0) (0/0) (0/0) engine=tsm1
Oct 15 11:08:35 db influxd[14169]: [I] 2017-10-15T09:08:34Z compact id=848 (0/0) (0/0) (0/0) (0/0) engine=tsm1
Oct 15 11:08:35 db influxd[14169]: [I] 2017-10-15T09:08:34Z compact id=981 (0/0) (0/0) (0/0) (0/0) engine=tsm1
Oct 15 11:08:35 db influxd[14169]: [I] 2017-10-15T09:08:34Z compact id=1073 (0/0) (0/0) (0/0) (0/0) engine=tsm1
Oct 15 11:08:35 db influxd[14169]: [I] 2017-10-15T09:08:34Z compact id=1091 (0/0) (0/0) (0/0) (0/0) engine=tsm1
Oct 15 11:08:35 db influxd[14169]: [I] 2017-10-15T09:08:34Z compact id=1117 (0/0) (0/0) (0/0) (0/0) engine=tsm1
 bong0
on 15 Oct 2017
bong0
on 15 Oct 2017
@bong0 that sounds like a deadlock somewhere. Next time it happens can you SIGQUIT influxdb, which should dump a stacktrace that can give us clues as to what's blocked. You can either hit ctrl \ in a terminal if it's in the foreground or do something like kill -s SIGQUIT <pid_of_influxd>.
e-dard
on 16 Oct 2017
@e-dard I'd really like to provide you with the stacktrace but currently influxdb crashes (again) due to OOM (bloom filters allocating >10GiBs of memory)... The halt appeared without influx exceeding memory limitations though, to be clear.
bong0
on 16 Oct 2017
@bong0 is the bloom filter crash even when using the update that you said in another comment reduces your memory usage significantly?
e-dard
on 16 Oct 2017
@e-dard yep, I'm using v1.4.0~n201710130800 as stated above. The new bloom filter helped me to get more data into influx than before but my current measurement is so large that at the end of startup it reaches ~95% (%MEM) memory in top already. Starting the import then results in an OOM within ~10mins. So between the joy of less mem usage from #8857 and the OOMs now, I encountered the 'halt' phenomenum discussed here.
bong0
on 16 Oct 2017
@bong0 Are you backfilling historical data and writing to many shards as you backfill? If so, you may need to adjust your cache-snapshot-write-cold-duration and/or alter your shard group duration.
This post may or may not be relevant to you if you are backfilling data.
jwilder
on 16 Oct 2017
@bong0 I wouldn't trust memory usage reported by top. Go takes a lot from the OS that it doesn't actually need/use immediately. Once you get started up you can inspect http://localhost:8086/debug/vars and look at the "memstats"."HeapInuse" value to see the current in-use heap size in bytes.
As well as the historical issue Jason mentions—how are you importing the data? Are you using the -import flag of the influx client?
e-dard
on 16 Oct 2017
@e-dard The RSS field in top doesn't count overallocated memory. Not all memory used by go is heap memory.
phemmer
on 16 Oct 2017
@jwilder Yes I am batch-importing historical data daywise (so for each sensor, a day is imported via one write request)
I already lowered cache-snapshot-write-cold-duration to 5m as I suspected this to be good but not as low as 10s.
Thanks a lot for the hint on the post! That seems to have given me answers to what I'm trying to do.
=> Sorry for not reading this last part of the FAQ about historical data, I probably didn't find it because I searched for batch-import etc. It's probably worth tagging this section more extensively and write a summary regarding the recommendation that if one wants to have infinitely stored data, one should set retention to INF and group duration to 100y or so (I'd also do this, but didn't find how to contribute to the docs at CONTRIBUTING)
Let's see how the import works out now.
@e-dard I'm monitoring runtime.HeapInuse (note: not "memstats") 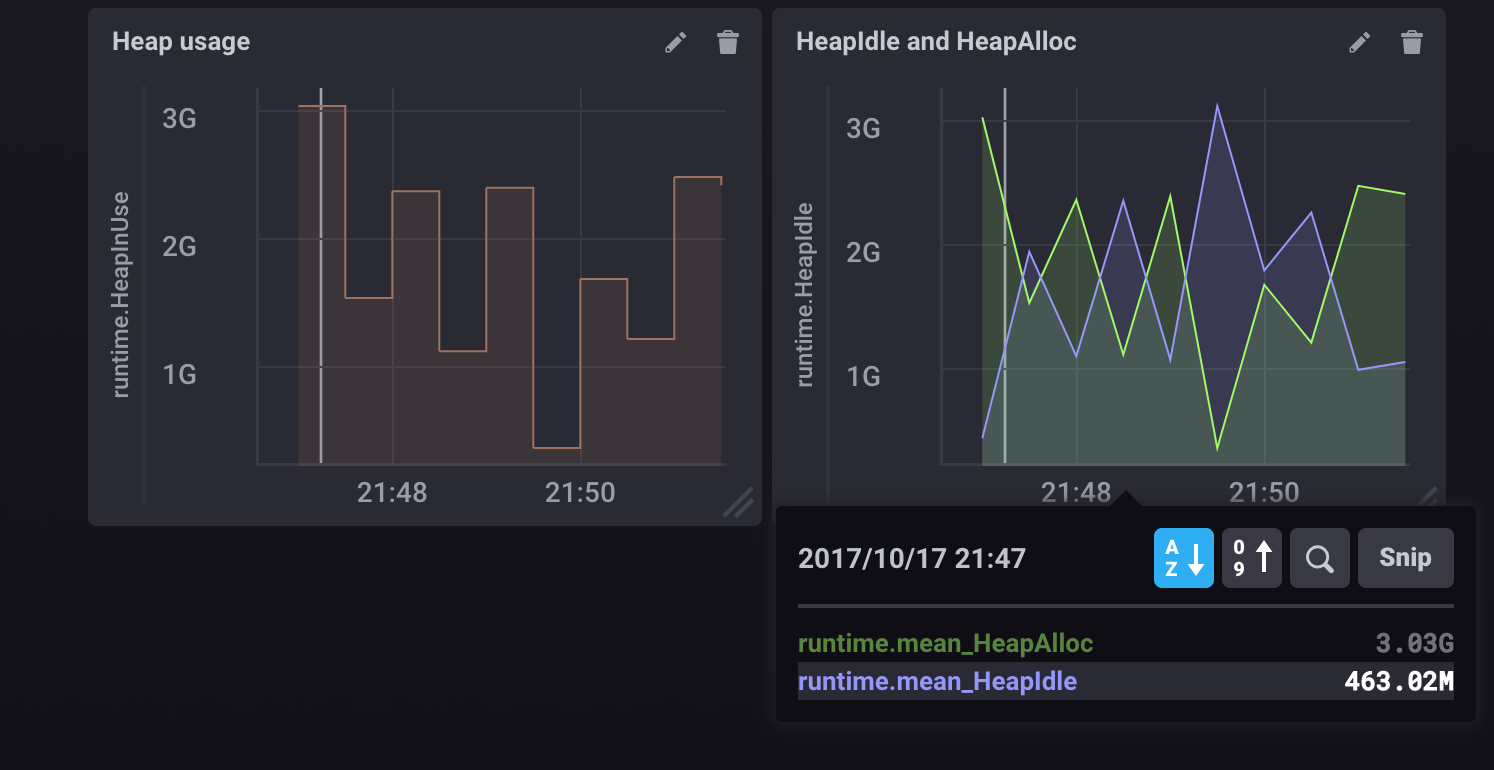 after keeping the number of shard groups at one.
So for me, keeping the num of shard groups down seems to solve the issue of the maybe-deadlock (importing for >20h now).
To answer your question on the import flag: I'm not using the client because written in lineprotocol, my dataset would be too large on disk, I use http and send chunks instead.
bong0
on 17 Oct 2017
Same problem. My influxdb version is 1.2.1, and write timeout after several minutes influxd restart. But still can response query requests.
Here are the logging text, I still cannot find a workaround for several hours.
Influxdb is built in our production environment and it's a bit urgent, hope anyone can help.
@e-dard @jwilder
 hzhaop
on 4 Dec 2017
hzhaop
on 4 Dec 2017
@hzhaop that's quite an old version of InfluxDB. I would really recommend upgrading to the latest version.
e-dard
on 5 Dec 2017
@e-dard I upgrade to 1.3.6, but still not work.
hzhaop
on 6 Dec 2017
@hzhaop the latest version is 1.4.2
e-dard
on 6 Dec 2017
@e-dard I think the confusion comes from the fact that you don't ship 1.4.x in the download section but not in the repos (debian at least) Sorry, this is not the case anymore https://repos.influxdata.com/ubuntu/dists/wheezy/stable/binary-amd64/Packages
bong0
on 6 Dec 2017
I'm seeing this in 1.4.2. It's happening every time, even after restarting the server. I'm saving two values over HTTP every 10 seconds. The values are actually saved, but the HTTP request returns 500 immediately.
I'm also affected by https://github.com/influxdata/influxdb/issues/8036.
My database is somewhat old, maybe that's a factor.
 lnicola
on 19 Jan 2018
lnicola
on 19 Jan 2018
Seeing this issue pop-up in every other InfluxDB release doesn't inspire confidence to upgrade to latest versions of InfluxDB. I think it's time for the Influxdb team to do longevity test runs on the HTTP endpoint ...
antonioaguilar
on 22 Jan 2018
For anyone else affected by this except @rhuddleston: do you have wal-fsync-delay set to a large value?
lnicola
on 28 Mar 2018
"timeout" service=httpd happenes to me (version v1.4.3) after setting wal-fsync-delay to value greater than 1s and I wanted something around 60s...
 tombokombo
on 23 Apr 2018
tombokombo
on 23 Apr 2018
@tombokombo Then don't do that. I posted above because I'd made the same mistake. The endpoint answers only after the data has been persisted to disk, but it has a timeout of 10 seconds by default, I think (coordinator.write-timeout). If data.wal-fsync.delay is longer than that, you'll run into this error.
A configuration check on start-up might be nice, though.
lnicola
on 23 Apr 2018
@antonioaguilar are you still struggling with this issue? Are you running 1.5.2? We're not aware of any issues running the server for long periods (months, years).
@lnicola can you upgrade to 1.5.2 and if you still have an issue then please open a fresh ticket.
e-dard
on 23 Apr 2018
@e-dard Did something change specifically in 1.5.2? I was probably on 1.5.1 when I posted.
In my case (if it wasn't clear from my comment above), it wasn't an InfluxDB bug, but a misconfiguration. So the behaviour actually made sense, although I still think a warning would be a good idea.
It's quite possible that @tombokombo -- maybe along with others in this thread -- was in the same situation.
lnicola
on 23 Apr 2018
@e-dard .. I just hit something very similar to this. I had set the below params
      wal-fsync-delay = "10s" # We can tolerate a few sec of data loss
# together with
      write-timeout = "10s"
And the DB froze. Almost everything was giving timeout errors. I don't mind loosing the last 10s of data, which is why I set this. But after reading this thread, I now realize this is probably a misconfiguration. A startup check that fsync-delay is smaller than the timeout would have been very nice! Thanks folks
 kim0
on 19 May 2018
kim0
on 19 May 2018
Does somebody have any further information on this issue? I'm using InfluxDB v1.7.5 (git: 1.7 2f49e00f7f3801a506304c3b6d8165b2f4039f3d) which seems to be
the newest release. The behaviour of the database is the same as described in this issue.
All query/write requests to a specific database return
{"error":"timeout"}
Using the influx cli it is still possible to authenticate with a user and query _internal measurements.
The following command also seems to not run successfully since I had to cancel it after running for > 7 minutes.
curl -o profiles.tar.gz "http://localhost:8086/debug/pprof/all"
The issue seems to arise after a certain amount of writes, however the exact number differs. I could test this since the data/requests that were written in the past can be reconstructed and thus reimported into a newly installed influxdb. When setting up a clean influxdb and reimporting the data for the past it fails after 20,000 - 100,000 measurements.
Those measurements get written in batches of 100-300 measurements at a time via the /write endpoint.
When just setting up the database in a clean state the same issue occurs without reimporting the historical data after roughtly the same number of measurements.
Docker System information:
Server: Docker Engine - Community
 Engine:
  Version:          18.09.4
  API version:      1.39 (minimum version 1.12)
  Go version:       go1.10.8
  Git commit:       d14af54
  Built:            Wed Mar 27 18:01:48 2019
  OS/Arch:          linux/amd64
  Experimental:     false
/etc/influxdb/influxdb.conf
[meta]
  dir = "/var/lib/influxdb/meta"

[data]
  dir = "/var/lib/influxdb/data"
  engine = "tsm1"
  wal-dir = "/var/lib/influxdb/wal"
 LukasAuerbeck
on 12 Apr 2019
LukasAuerbeck
on 12 Apr 2019
@LukasAuerbeck
I have the same problem. Let try the version 1.7.4.
https://github.com/influxdata/influxdb/issues/8036#issuecomment-481319254
 dracula92107
on 12 Apr 2019
dracula92107
on 12 Apr 2019
Thanks for the response! Downgrading solved the problem
LukasAuerbeck
on 15 Apr 2019
Thanks for the response! Downgrading solved the problem
Which version did you downgrade?
 benjamin658
on 19 Apr 2019
benjamin658
on 19 Apr 2019
Which version did you downgrade?
1.7.4
LukasAuerbeck
on 19 Apr 2019
Note that 1.7.6 was released a week ago with the following message:
If your InfluxDB OSS server is using the default in-memory index ([data].index-version = "inmem"), this release includes the fix for InfluxDB 1.7.5 servers that stopped responding without warning.
 LordMike
on 22 Apr 2019
LordMike
on 22 Apr 2019
I've tried 1.7.6 and get the same issue
 sorrison
on 18 Jul 2019
sorrison
on 18 Jul 2019
This issue has been automatically marked as stale because it has not had recent activity. It will be closed if no further activity occurs. Thank you for your contributions.
![stale[bot] picture](https://avatars3.githubusercontent.com/in/1724?v=4&s=40) stale[bot]
on 16 Oct 2019
stale[bot]
on 16 Oct 2019
This issue has been automatically closed because it has not had recent activity. Please reopen if this issue is still important to you. Thank you for your contributions.
stale[bot]
on 23 Oct 2019
Related issues
 binary0111
·
3Comments
binary0111
·
3Comments
 acarapetis
·
3Comments
acarapetis
·
3Comments
 Raniz85
·
3Comments
Raniz85
·
3Comments
 robinjha
·
3Comments
robinjha
·
3Comments
 dtouzeau
·
3Comments
dtouzeau
·
3Comments
Most helpful comment
@LukasAuerbeck
I have the same problem. Let try the version 1.7.4.
https://github.com/influxdata/influxdb/issues/8036#issuecomment-481319254