Influxdb: non_negative_derivative and group by sizing causing large spikes
Hi,
We're using InfluxDB 0.12.0 and Grafana 3.0.0 beta31460390657. We're monitoring systems that output continually increasing counters (Lustre) via Telegraf. The metrics are being collected by Telegraf every 10s.
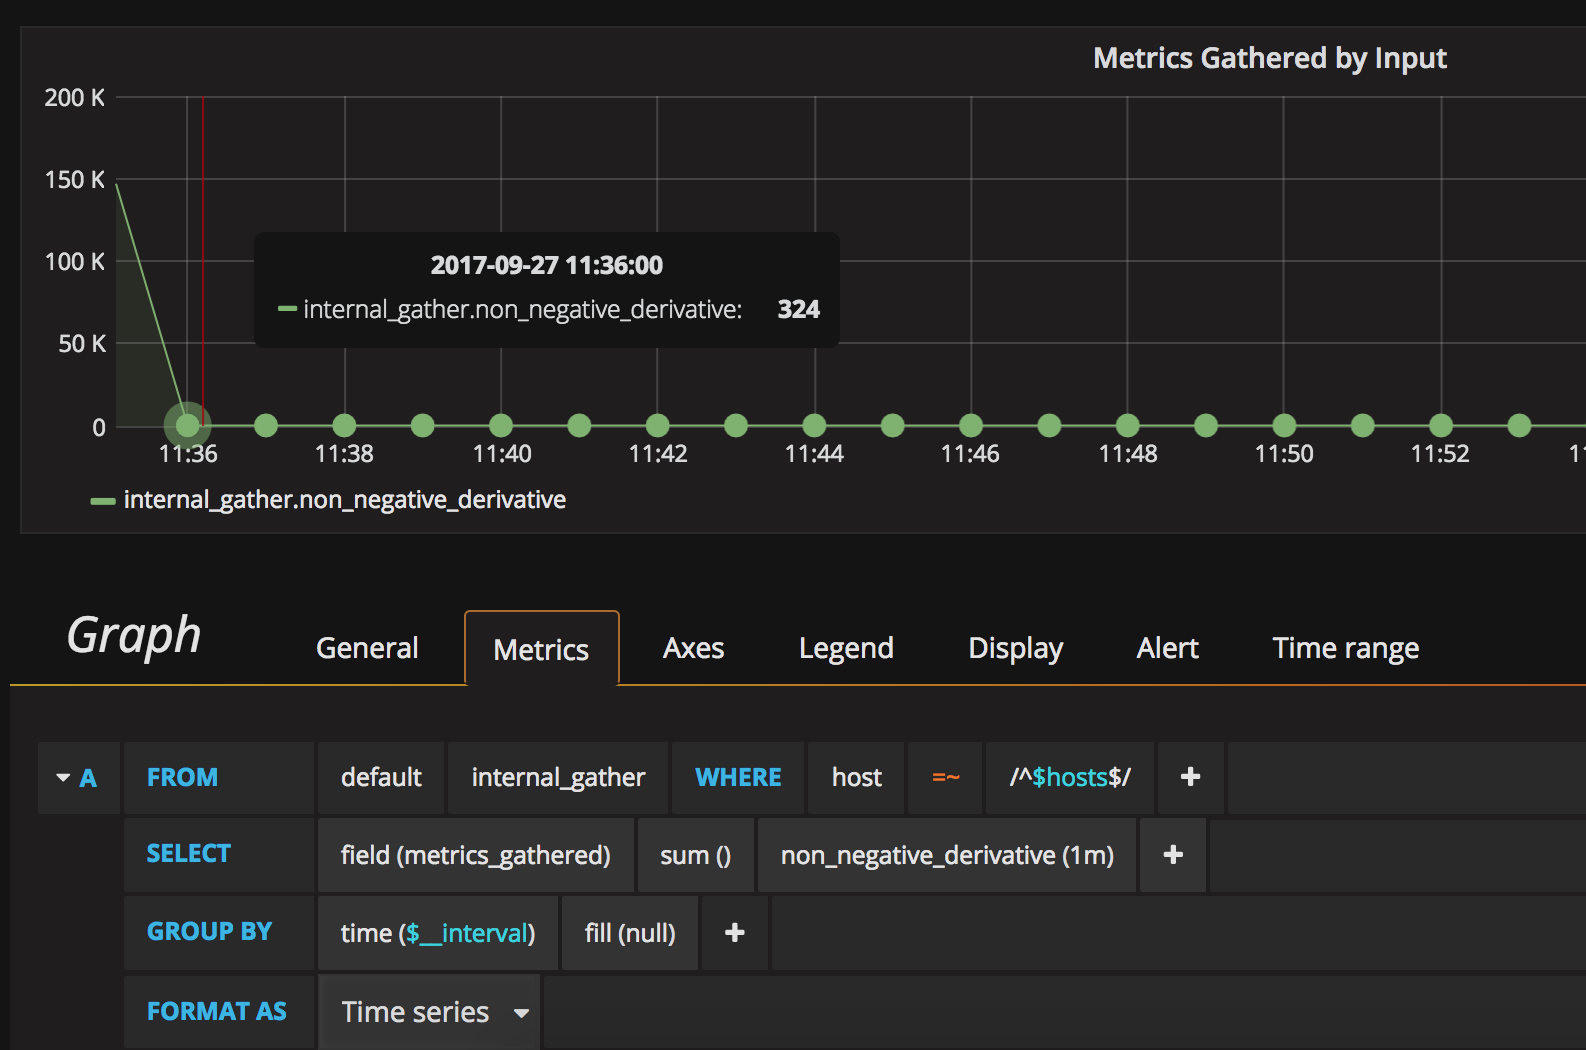
For smaller time ranges the graphs are accurate. However for larger time periods InfluxDB sends back data with a very large spike at the beginning. I've noticed this seems to stem from the larger GROUP BY time() values that Grafana selects when you view data over a larger time period.
If I manually select a GROUP BY time(10s) the data is always correct. If I let Grafana auto-select with a GROUP BY time($interval), I see the issue. Note that the issue is periodic - sometimes the large interval works and sometimes it doesn't. I'm guessing this is because I'm using now() in my queries so at certain times the times align correctly.
So to cut Grafana out of the equation I've manually run the queries to illustrate the issue. If I use GROUP BY time(10s), this query always returns correct data no matter how many times I try it:
> SELECT non_negative_derivative(sum("read_bytes"), 1s) FROM "lustre2" WHERE time > now() - 6h GROUP BY time(10s) fill(null) LIMIT 10;
name: lustre2
-------------
time                    non_negative_derivative
1461153160000000000     0
1461153170000000000     0
1461153180000000000     0
1461153190000000000     0
1461153200000000000     0
1461153210000000000     0
1461153220000000000     0
1461153230000000000     0
1461153240000000000     0
1461153250000000000     0
However, if I increase to GROUP BY time(30s) and run two queries that were less than a second apart:
> SELECT non_negative_derivative(sum("read_bytes"), 1s) FROM "lustre2" WHERE time > now() - 6h GROUP BY time(30s) fill(null) LIMIT 10;
name: lustre2
-------------
time                    non_negative_derivative
1461153210000000000     0
1461153240000000000     0
1461153270000000000     0
1461153300000000000     0
1461153330000000000     0
1461153360000000000     0
1461153390000000000     0
1461153420000000000     0
1461153450000000000     0
1461153480000000000     0

> SELECT non_negative_derivative(sum("read_bytes"), 1s) FROM "lustre2" WHERE time > now() - 6h GROUP BY time(30s) fill(null) LIMIT 10;
name: lustre2
-------------
time                    non_negative_derivative
1461153210000000000     4.387031397146e+11
1461153240000000000     0
1461153270000000000     0
1461153300000000000     0
1461153330000000000     0
1461153360000000000     0
1461153390000000000     0
1461153420000000000     0
1461153450000000000     0
1461153480000000000     0
In fact if I run this query every second, in seconds 1 - 10 the first value is 0, in seconds 11-20, the first value is a very large number, and in seconds 21 - 30, the first value is an even larger number (almost exactly double). Then the first value returns to 0 after that and the cycle starts again. This is due to the sum values being very different (three queries run with about 10s in between):
> SELECT sum("read_bytes") FROM "lustre2" WHERE time > now() - 6h GROUP BY time(30s) LIMIT 10;
name: lustre2
-------------
time                    sum
1461153630000000000     13161094191438
1461153660000000000     39483282574314
1461153690000000000     39483282574314
1461153720000000000     39483282574314
1461153750000000000     39483282574314
1461153780000000000     39483282574314
1461153810000000000     39483282574314
1461153840000000000     39483282574314
1461153870000000000     39483282574314
1461153900000000000     39483282574314

> SELECT sum("read_bytes") FROM "lustre2" WHERE time > now() - 6h GROUP BY time(30s) LIMIT 10;
name: lustre2
-------------
time                    sum
1461153660000000000     26322188382876
1461153690000000000     39483282574314
1461153720000000000     39483282574314
1461153750000000000     39483282574314
1461153780000000000     39483282574314
1461153810000000000     39483282574314
1461153840000000000     39483282574314
1461153870000000000     39483282574314
1461153900000000000     39483282574314
1461153930000000000     39483282574314

> SELECT sum("read_bytes") FROM "lustre2" WHERE time > now() - 6h GROUP BY time(30s) LIMIT 10;
name: lustre2
-------------
time                    sum
1461153660000000000
1461153690000000000     39483282574314
1461153720000000000     39483282574314
1461153750000000000     39483282574314
1461153780000000000     39483282574314
1461153810000000000     39483282574314
1461153840000000000     39483282574314
1461153870000000000     39483282574314
1461153900000000000     39483282574314
1461153930000000000     39483282574314
When I look at the raw data points they are staying constant as expected since there is no activity right now (using one host as an example):
> SELECT read_bytes FROM "lustre2" WHERE "host"='hpcleo00' GROUP BY "name" LIMIT 10;
name: lustre2
tags: name=lustree-OST0000
time                    read_bytes
----                    ----------
1459977920000000000     39325212672
1459977930000000000     39325212672
1459977940000000000     39325212672
1459977950000000000     39325212672
1459977960000000000     39325212672
1459977970000000000     39325212672
1459977980000000000     39325212672
1459977990000000000     39325212672
1459978000000000000     39325212672
1459978010000000000     39325212672

name: lustre2
tags: name=lustree-OST0001
time                    read_bytes
----                    ----------
1459977920000000000     39718395904
1459977930000000000     39718395904
1459977940000000000     39718395904
1459977950000000000     39718395904
1459977960000000000     39718395904
1459977970000000000     39718395904
1459977980000000000     39718395904
1459977990000000000     39718395904
1459978000000000000     39718395904
1459978010000000000     39718395904

name: lustre2
tags: name=lustree-OST0002
time                    read_bytes
----                    ----------
1459977920000000000     59411320832
1459977930000000000     59411320832
1459977940000000000     59411320832
1459977950000000000     59411320832
1459977960000000000     59411320832
1459977970000000000     59411320832
1459977980000000000     59411320832
1459977990000000000     59411320832
1459978000000000000     59411320832
1459978010000000000     59411320832
name: lustre2
tags: name=lustree-OST0003
time                    read_bytes
----                    ----------
1459977920000000000     59857276928
1459977930000000000     59857276928
1459977940000000000     59857276928
1459977950000000000     59857276928
1459977960000000000     59857276928
1459977970000000000     59857276928
1459977980000000000     59857276928
1459977990000000000     59857276928
1459978000000000000     59857276928
1459978010000000000     59857276928

name: lustre2
tags: name=lustree-OST0004
time                    read_bytes
----                    ----------
1459977920000000000     39734607872
1459977930000000000     39734607872
1459977940000000000     39734607872
1459977950000000000     39734607872
1459977960000000000     39734607872
1459977970000000000     39734607872
1459977980000000000     39734607872
1459977990000000000     39734607872
1459978000000000000     39734607872
1459978010000000000     39734607872
Note that I have also tried all the fill options (none, null, 0, previous) and they do not help.
I've read through https://github.com/influxdata/influxdb/issues/4237, https://github.com/influxdata/influxdb/pull/4292, and all the linked issues, but I think this is different.
Thanks,
Shawn
 shawnahall71
All 36 comments
Hey, I guess here is the same problem:
I have the reporters that reports stats into influxdb once a minute. This is typical counter metrics that constantly grows.
What I'm try to achieve is to get a rate of request per minute. Here is my QUERY:
SELECT non_negative_derivative(sum("run-count"), 1m) FROM "com.codahale.metrics.servlet.AbstractInstrumentedFilter.requests" WHERE time > now() - 10m GROUP BY time(1m) fill(none)
- non_negative_derivative - to omit negative couter differences during node resets.
And here is what I get doing three requests with a ~15-20 sec delay between each of them:
> SELECT non_negative_derivative(sum("run-count"), 1m) FROM "com.codahale.metrics.servlet.AbstractInstrumentedFilter.requests" WHERE time > now() - 10m GROUP BY time(1m) fill(none)
name: com.codahale.metrics.servlet.AbstractInstrumentedFilter.requests
----------------------------------------------------------------------
time                    non_negative_derivative
1460405880000000000     101864
1460405940000000000     137
1460406000000000000     130
1460406060000000000     137
1460406120000000000     139
1460406180000000000     122
1460406240000000000     143
1460406300000000000     146
1460406360000000000     161
> SELECT non_negative_derivative(sum("run-count"), 1m) FROM "com.codahale.metrics.servlet.AbstractInstrumentedFilter.requests" WHERE time > now() - 10m GROUP BY time(1m) fill(none)
name: com.codahale.metrics.servlet.AbstractInstrumentedFilter.requests
----------------------------------------------------------------------
time                    non_negative_derivative
1460405880000000000     209000
1460405940000000000     137
1460406000000000000     130
1460406060000000000     137
1460406120000000000     139
1460406180000000000     122
1460406240000000000     143
1460406300000000000     146
1460406360000000000     161
> SELECT non_negative_derivative(sum("run-count"), 1m) FROM "com.codahale.metrics.servlet.AbstractInstrumentedFilter.requests" WHERE time > now() - 10m GROUP BY time(1m) fill(none)
name: com.codahale.metrics.servlet.AbstractInstrumentedFilter.requests
----------------------------------------------------------------------
time                    non_negative_derivative
1460405940000000000     137
1460406000000000000     130
1460406060000000000     137
1460406120000000000     139
1460406180000000000     122
1460406240000000000     143
1460406300000000000     146
1460406360000000000     161
1460406420000000000     130
Actually what I expected to get is the last results section, where the first value is more or less the sane as others. First and second sections had a huge numbers in the top. I assume each time every node reports it's data to influxdb the top number changes. Each minute this scenario repeats again.
Influxdb 0.12.1
 filipkokorevs
on 23 Apr 2016
filipkokorevs
on 23 Apr 2016
Is this related to #4852 ?
 jwestboston
on 28 Apr 2016
jwestboston
on 28 Apr 2016
@jwestboston: you are right, it is.
filipkokorevs
on 28 Apr 2016
This is a duplicate of #3247 and will be fixed for aggregate queries in 0.13. Please try it out on master to confirm that this works properly. If it doesn't, please reopen this ticket with any information to help fix it.
Thanks!
 jsternberg
on 2 May 2016
jsternberg
on 2 May 2016
@jsternberg I see the same behavior in InfluxDB 0.13.0~n201605020800. I don't have any additional information to help fix it other than what I wrote in my original post.
shawnahall71
on 2 May 2016
This seems to have been fixed for _continuous_ queries in the 0.13 series but not for direct/"raw" queries. The relevant comment is here.
On further searching, this is possible dupe of #5943.
 onnos
on 5 Jun 2016
onnos
on 5 Jun 2016
For what it's worth I'm experiencing this on 0.13 with a direct/"raw" query for GPFS performance metrics (instead of Lustre). If there's something I can do to help fix this, please let me know.
 aaronknister
on 8 Jul 2016
aaronknister
on 8 Jul 2016
Still happens on 1.0 👎
 hgfischer
on 28 Sep 2016
hgfischer
on 28 Sep 2016
@hgfischer +1
filipkokorevs
on 28 Sep 2016
Are there plans to fix this? I have to add offset 1 to all queries doing non_negative_derivative(sum("value"), 10s) to not get the spike as the first value.
 panzerdev
on 23 Oct 2016
panzerdev
on 23 Oct 2016
We are hitting this, too. It's frustrating; we have hundreds of graphs of rates (non_negative_derivative), and this bug is rendering them fairly useless. Can we get a sense of whether this will be fixed?
 RonRothman
on 4 Nov 2016
RonRothman
on 4 Nov 2016
In case it's helpful, my work around has been to create continuous queries to pre-calculate derivatives and then my grafana queries access the "rate" series instead of the "raw" series.
aaronknister
on 5 Nov 2016
I have same problem.
@panzerdev , thanks for the offset idea.
 alekseyp
on 19 Nov 2016
alekseyp
on 19 Nov 2016
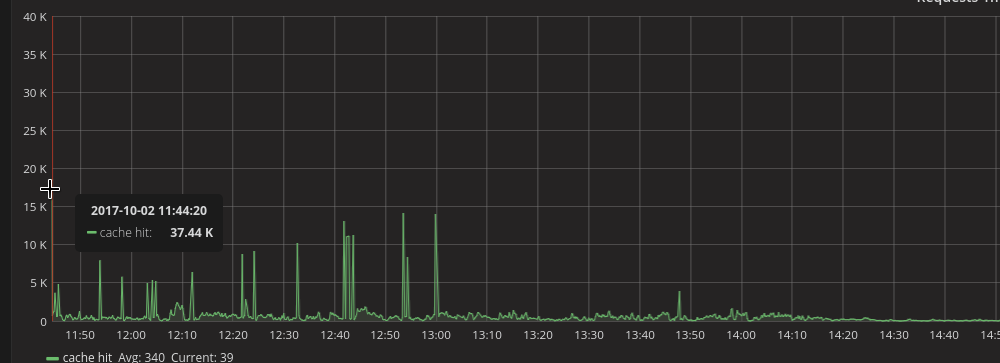
Same here. We're collecting nginx total request count as well as network total bytes transmitted stats. Because the first bar in a grouped query is smaller than the others, there's a huge spike in the beginning most of the time.
 dbrgn
on 16 Feb 2017
dbrgn
on 16 Feb 2017
I have same problem. Setting offset 1 and the time of group by Is greater than 20 can solve it.
thanks the offset idea @panzerdev
 janceChun
on 8 Mar 2017
janceChun
on 8 Mar 2017
I've been looking over this problem as a user, and it doesn't appear that this is an actual bug. What's happening is that when you set upper/lower bounds on the time range using TIME() plus or minus some interval, and that time range doesn't 100% align with the buckets in your GROUP BY interval, SUM() ends up summing less points into the first and last buckets than you expect -- this is actually the case regardless of whether derivatives are involved. As a result, both the first and last data points being differenced are smaller than expected. When you use DERIVATIVE(), this manifests as a huge jump between that first bucket value, based on incomplete data, and the second bucket value, based on complete data (and vice versa at the end). As a result, you start the series with an enormous positive spike and end it with an enormous negative one.
To get the results we want, what we really need is a way to normalize the time boundaries on the query so they align with the bucket width. This is probably a task best left to Grafana or another dashboard.
 jgoldschrafe
on 29 Apr 2017
jgoldschrafe
on 29 Apr 2017
From a UX perspective, this could conceivably be solved in InfluxDB if TIME() could be rounded up or down to an arbitrary interval, so a query writer could align the start and end of the window to match the bucketing interval specified in GROUP BY.
jgoldschrafe
on 29 Apr 2017
We are experiencing the same issue and many thanks @panzerdev for the offset idea.
 crab86
on 13 Jun 2017
crab86
on 13 Jun 2017
We have the same issue and it is very annoying especially when working with Grafana.
https://github.com/grafana/grafana/issues/9361
 wei-hai
on 29 Sep 2017
wei-hai
on 29 Sep 2017
Hitting this issue as well in InfluxDB 1.2.4. non_negative_derivative with sum() as an aggregator creates a huge spike at the beginning of the graph and makes the rest of the chart unreadable. Based on @jgoldschrafe's comment above, it seems like this might be related to #5943 and/or #6878 .
 rhefner1
on 2 Oct 2017
rhefner1
on 2 Oct 2017
We also see this issue with many graphs
 kpmueller
on 3 Oct 2017
kpmueller
on 3 Oct 2017
I am seeing this as well on several graphs - very difficult to read graphs when a spike occurs.
 bfgoodrich
on 5 Oct 2017
bfgoodrich
on 5 Oct 2017
Do we have any updates on this issue? I see the same spikes with many of my graphs when using non_negative_derivative and group by.
 lohitv9
on 14 Feb 2018
lohitv9
on 14 Feb 2018
A lot of useful information here! my today's workaround for this is to apply specific time range in Grafana. Usually the auto interval for longer time ranges is 5 minutes. Then to ensure time range does not cross the intervals we use /h to round it to whole hours. Unfortunately it means also that from 7:00:01 to 8:00:00 the latest data you see is from 6:59:59 and it could be a serious issue for some of you.
From: now-2d/h
To: now-1h-1s/h
It would be cool to have in Grafana sth like /5m or /$__interval.
 to-masz
on 15 Feb 2018
to-masz
on 15 Feb 2018
I managed to get rid of those spikes by using percentile(95) selector instead of mean() aggregation. So if this makes sense for your data you can use this workaround.
 beriba
on 9 Mar 2018
beriba
on 9 Mar 2018
this cheat works for me
 vladimir-bukhtoyarov
on 27 Aug 2018
vladimir-bukhtoyarov
on 27 Aug 2018
Are there plans to fix this? I have to add
offset 1to all queries doingnon_negative_derivative(sum("value"), 10s)to not get the spike as the first value.
@panzerdev How you added offset? Can you provide some sample query? Thanks
 hardiksondagar
on 15 Nov 2018
hardiksondagar
on 15 Nov 2018
@hardiksondagar There you go
 SELECT non_negative_derivative(sum("value"), 1s) AS "qps" FROM "jetty.responses2xx" WHERE
"cluster" = 'uluru-api' AND $timeFilter GROUP BY time(1m), "cluster" offset 1
 jiacai2050
on 15 Nov 2018
jiacai2050
on 15 Nov 2018
Still seeing the issue. Spikes at start and end of graphs are still visible when doing a group by on time.
 piyushGoyal2
on 4 Feb 2019
piyushGoyal2
on 4 Feb 2019
This issue has been automatically marked as stale because it has not had recent activity. It will be closed if no further activity occurs. Thank you for your contributions.
![stale[bot] picture](https://avatars3.githubusercontent.com/in/1724?v=4&s=40) stale[bot]
on 23 Jul 2019
stale[bot]
on 23 Jul 2019
Still present and still problematic
 CameronJHall
on 25 Jul 2019
CameronJHall
on 25 Jul 2019
Yes. It is still present and is still very problematic.
This issue happens to be open for more than 3 years now.
Regards,
Lohit
On Jul 25, 2019, 2:20 PM -0500, Cameron Hall notifications@github.com, wrote:
Still present and still problematic
—
You are receiving this because you commented.
Reply to this email directly, view it on GitHub, or mute the thread.
lohitv9
on 25 Jul 2019
This issue has been automatically marked as stale because it has not had recent activity. It will be closed if no further activity occurs. Thank you for your contributions.
stale[bot]
on 23 Oct 2019
Still present and still problematic
 hildeb
on 23 Oct 2019
hildeb
on 23 Oct 2019
Hello,
Facing the same situation, at Transatel we decided to solve it by making an HTTP proxy to handle this: Transatel/cleanflux.
We've been using it for 2 whole years, both from Grafana and various scripts (including Jupyter notebooks).
For now, it is quite declarative (retention policies have to be redeclared in proxy configuration) but this solution is pretty robust and transparent for the client.
In addition, it also solves issues #5961 (and dup #8010) and #7198.
 p3r7
on 15 Jan 2020
p3r7
on 15 Jan 2020
Thank you.
I have been waiting on a solution to this forever.
I will give it a try.
Regards,
Lohit
On Jan 15, 2020, 6:53 AM -0600, perf notifications@github.com, wrote:
Hello,
Facing the same situation, at Transatel we decided to solve it by making an HTTP proxy to handle this: Transatel/cleanflux.
We've been using it for 2 whole years, both from Grafana and various scripts (including Jupyter notebooks).
For now, it is quite declarative (retention policies have o be redeclared in proxy configuration) but this solution is pretty robust and transparent for the client.
In addition, it also solves issues #5961 and #7198.
—
You are receiving this because you commented.
Reply to this email directly, view it on GitHub, or unsubscribe.
lohitv9
on 15 Jan 2020
Related issues
 udf2457
·
3Comments
udf2457
·
3Comments
 ricco24
·
3Comments
ricco24
·
3Comments
 dtouzeau
·
3Comments
dtouzeau
·
3Comments
 Raniz85
·
3Comments
Raniz85
·
3Comments
 affo
·
3Comments
affo
·
3Comments
Most helpful comment
Are there plans to fix this? I have to add
offset 1to all queries doingnon_negative_derivative(sum("value"), 10s)to not get the spike as the first value.