Incubator-superset: Custom visualizations with python code
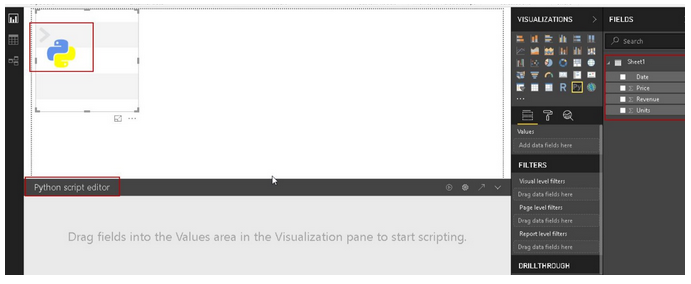
I would be really nice if it was possible to create your own visualizations with simple Python code instead of writing a whole new panel/plugin. You write in the FAQ that you are working on making it easier to add new visualizations to the framework, and I hope you will consider this idea. I imaging a visualisation type/plugin called Python code, where you can add a data source, and then you can write any python code that outputs a html visualization using the data source. You can take a look at powerbi, where one can add both custom r and python visualizations (although the panels don't support html-outputs here).
 tobiasdirksen
All 4 comments
Thanks @tobiasdirksen , This is a great idea worth exploring 👍 If you have any suggestions for how this should work in practice in the context of Superset I encourage posting here to get the discussion started.
 villebro
on 5 May 2020
villebro
on 5 May 2020
Hi if we are having Jupyter notebook like component for processing this visualisations in the superset
 kalimuthu123
on 6 May 2020
kalimuthu123
on 6 May 2020
Is there documentation to create custom panels and data sources in wiki pages? We have done a lot of panels and data sources for Grafana, looking forward to adapt superset for few projects.
 gopalakrishnan-subramani
on 15 May 2020
gopalakrishnan-subramani
on 15 May 2020
Recent blog post explaining how to create plugins.
https://preset.io/blog/2020-07-02-hello-world/
Plugins are now 100% defined in javascript. We can improve the /api/v1/query endpoint that is implemented in Python to do more pre-processing of data in the backend, but all visualizations will be defined in JS/TS from this point on.
 mistercrunch
on 7 Jul 2020
mistercrunch
on 7 Jul 2020
Related issues
 ghost
·
3Comments
ghost
·
3Comments
 tmccartan
·
3Comments
tmccartan
·
3Comments
 amien90
·
3Comments
amien90
·
3Comments
 joshuacano
·
3Comments
joshuacano
·
3Comments
 ylkjick532428
·
3Comments
ylkjick532428
·
3Comments
Most helpful comment
Thanks @tobiasdirksen , This is a great idea worth exploring 👍 If you have any suggestions for how this should work in practice in the context of Superset I encourage posting here to get the discussion started.