Incubator-mxnet: Excessive GPU memory usage with dynamic shape input using Gluon interface
Description
When using threaded engine with dynamic shape input. MXNet uses excessive amount of GPU memory. In the following script, MXNet is only able to reach a batch size of 16 while TensorFlow, PyTorch and MXNet w/ NaiveEngine can reach a batch size of 256. Such behavior prevents me from training resnet101 fpn bn mask rcnn model even on 32GB of GPU memory. The same behavior is observed on hybridized model as well
To Reproduce
The following script create a dynamically shaped dataset, dataloader, padding batchify, and a simple neural network. It train the network with exponentially increasing batch size. For every epoch, the batch size is multiply by 2.
https://gist.github.com/Jerryzcn/bc300b431f4c2868158f3a309dc44e78
Environment
AMI
Deep Learning AMI (Ubuntu 18.04) Version 26.0 - ami-010a96c958f9ee5cf
Instance Type
p3.16xlarge
Storage
GP2 volume with 2000GB capacity
Numpy Environment
None
MXNet Environment
MXNet(+Keras2) with Python3 (CUDA 10.1 and Intel MKL-DNN)
source activate mxnet_p36
Pytorch Environment
PyTorch with Python3 (CUDA 10.1 and Intel MKL)
source activate pytorch_p36
Tensorflow Environment
for TensorFlow 2(+Keras2) with Python3 (CUDA 10.0 and Intel MKL-DNN)
My Benchmark:
GPU Stress Test (higher is better)
| Test | Max Batchsize Reached | Max Throughput Reached (samples/sec) |
| --- | --- | --- |
| MXNet Random | 8 | 335.412 |
| MXNet Sorted | 16 | 659.268 |
| PyTorch Random | 256 | 354.547 |
| PyTorch Sorted | 256 | 564.02 |
| TensorFlow 2.0 Random | 128 | 267.031 |
| TensorFlow 2.0 Sorted | 128 | 471.632 |
| MXNet Optimized Random | 8 | 357.711 |
| MXNet Optimized Sorted | 16 | 685.75 |
| MXNet NaiveEngine Random | 512 | 295.208 |
| MXNet NaiveEngine Sorted | 256 | 409.581 |
 Jerryzcn
All 12 comments
@DickJC123 Could you take a look?
 ptrendx
on 16 Jan 2020
ptrendx
on 16 Jan 2020
Assigning @drivanov totake a look at this issue.
ptrendx
on 3 Mar 2020
I created a special MXNet tool for the collection of memory consumption statistics. Using this tool, I got the following memory allocation snapshot for this stress test.
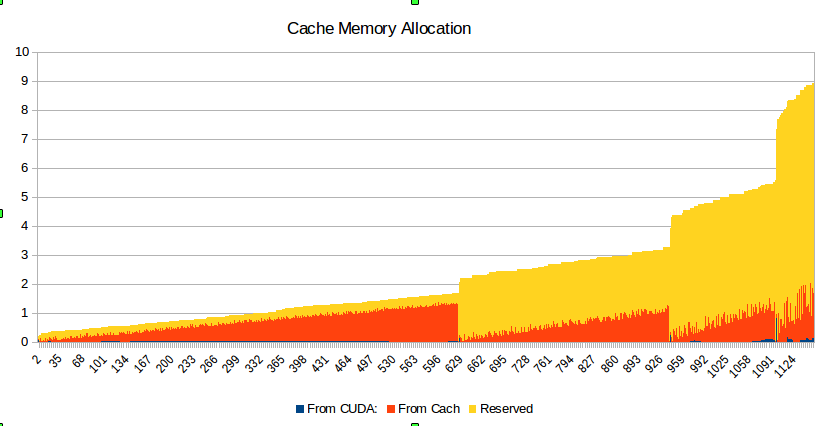
As we could see here, the memory actually used during the stress test for each batch size looks OK (see red and very tiny blue parts of the graph). But memory, which reserved in the cache (shown in yellow), grows exponentially with the batch size and for some reason, it is not released.
I am not sure if it is the only problem with this stress test. When the program crashes, I could see some error messages regarding some multithread issue in Python.
I will continue to work on that problem.
 andrei5055
on 31 Mar 2020
andrei5055
on 31 Mar 2020
Adding nd.waitall() between iterations release the reserved memory, but with the penalty of reduced throughout.
Jerryzcn
on 13 Apr 2020
This is a problem of having memory cache outside of memory manager and memory fragmentation. You can try mx.gpu(0).empty_cache() to alleviate the problem. @Jerryzcn @andrei5055
 szha
on 13 Apr 2020
szha
on 13 Apr 2020
@Jerryzcn, @szha. Thanks so much for your suggestions! I tried to use them, and this is what I saw in my experiments.
- I did not notice any advantage of using
mx.gpu(0).empty_cache(). On the contrary, sometimes I saw new crashes with the error message associated with this call. - Yes, I saw about 25-30% slowdown associated with using
mx.nd.waitall(). Unfortunately, it does not solve the initial GPU memory problem. - What makes this script approx. 30% faster is the usage of
del data_loaderafter internal loop in
for epoch in range(10):
        logger.info('Current batch size is: %d' % batchsize)
        os.system('free >> freeMemory.txt')
        data_loader = DataLoader(dataset, batch_size=batchsize,
                                batchify_fn=Tuple([Pad(pad_val=0), Pad(pad_val=0)]), num_workers=8)
        mx.gpu(0).empty_cache()
        btic = time.time()
        etic = time.time()
        for i, (src_data, dst_data) in enumerate(data_loader):
             . . .
            # Begin to update the parameter
            trainer.step(batchsize)
            . . .
        del data_loader
        batchsize *=2
Here is some evidence for this statement.
Initial version launched on datasetSize = 1000:
[Epoch 0], Speed: 95.212 samples/sec
[Epoch 1], Speed: 186.922 samples/sec
[Epoch 2], Speed: 312.916 samples/sec
[Epoch 3], Speed: 434.118 samples/sec
[Epoch 4], Speed: 405.835 samples/sec
[Epoch 5], Speed: 222.373 samples/sec
[Epoch 6], Speed: 18.799 samples/sec
[Epoch 7], Speed: 88.688 samples/sec
[Epoch 8], Speed: 371.118 samples/sec
[Epoch 9], Speed: 75.738 samples/sec
 1.993E+02 GPU stress test elapsed time
With del data_loader on the same dataset:
[Epoch 0], Speed: 93.743 samples/sec
[Epoch 1], Speed: 180.014 samples/sec
[Epoch 2], Speed: 298.007 samples/sec
[Epoch 3], Speed: 405.286 samples/sec
[Epoch 4], Speed: 527.154 samples/sec
[Epoch 5], Speed: 633.825 samples/sec
[Epoch 6], Speed: 30.708 samples/sec
[Epoch 7], Speed: 64.030 samples/sec
[Epoch 8], Speed: 207.408 samples/sec
[Epoch 9], Speed: 140.913 samples/sec
 1.368E+02 GPU stress test elapsed time
@andrei5055 thanks for reporting back your finding. Sorry that I missed the part where you recreate the dataloader multiple times. It seems evident now that the problem is starvation and thrashing of the many processes that the dataloader construction creates. However, it's unclear why explicit deletion of dataloader helped, since the object is supposed to be reference counted and freed in the next iteration.
szha
on 24 May 2020
There are reference leaks in the Gluon data API. See the tests marked with garbage_expected in https://github.com/apache/incubator-mxnet/blob/c3aff732371d6177e5d522c052fb7258978d8ce4/tests/python/unittest/test_gluon_data.py
These tests were marked as garbage_expected as I didn't have time looking into the root cause of their reference leaks yet. Given the impact noted by @andrei5055 , this warrants further investigation.
 leezu
on 27 May 2020
leezu
on 27 May 2020
@andrei5055 as I fixed a few other reference leaks in the Gluon API, could you help verify if the del still helps improve performance on latest master?
leezu
on 27 May 2020
cc @zhreshold
szha
on 27 May 2020
@leezu: I tested the changes you made for PR 18328 by launching the same script 3 times with and without del data_loader. I still see that the program runs faster when del data_loader is used. The average run times for 1 test are
(a) with del: (77.0 + 75.8 + 80.6) / 3 = 77.8 sec
(b) without del: (83.2 + 84.7 + 82.5) / 3 = 83.46 sec.
So, with your changes, the relative difference has been reduced from 45.7% to 7.3%.
andrei5055
on 28 May 2020
Thank you for testing @andrei5055. That's encouraging. If you like, it would be great to test if https://github.com/apache/incubator-mxnet/commit/0210ce2c136afaa0f57666e5e1c659cab353f5f3 and https://github.com/apache/incubator-mxnet/commit/c3aff732371d6177e5d522c052fb7258978d8ce4 respectively further reduce the overhead
leezu
on 28 May 2020
Related issues
 qiliux
·
3Comments
qiliux
·
3Comments
 dushoufu
·
3Comments
dushoufu
·
3Comments
 luoruisichuan
·
3Comments
luoruisichuan
·
3Comments
 xzqjack
·
3Comments
xzqjack
·
3Comments
 seongkyun
·
3Comments
seongkyun
·
3Comments
Most helpful comment
I created a special MXNet tool for the collection of memory consumption statistics. Using this tool, I got the following memory allocation snapshot for this stress test.

As we could see here, the memory actually used during the stress test for each batch size looks OK (see red and very tiny blue parts of the graph). But memory, which reserved in the cache (shown in yellow), grows exponentially with the batch size and for some reason, it is not released.
I am not sure if it is the only problem with this stress test. When the program crashes, I could see some error messages regarding some multithread issue in Python.
I will continue to work on that problem.