Incubator-mxnet: Profiler RFC: Introducing new APIs
Profiler RFC: Introducing new APIs
Introducing New APIs
Motivation
MXNet comes with a profiler that allows users to monitor the performance of their models in two metrics: time and memory consumption. Internally, operator calls, C API calls, and memory allocation/deallocation are represented as events. For functions calls, we know the start and finish time of the events and therefore the duration. For memory operations, we know the time of the allocation/deallocation and the size of the memory chunk.
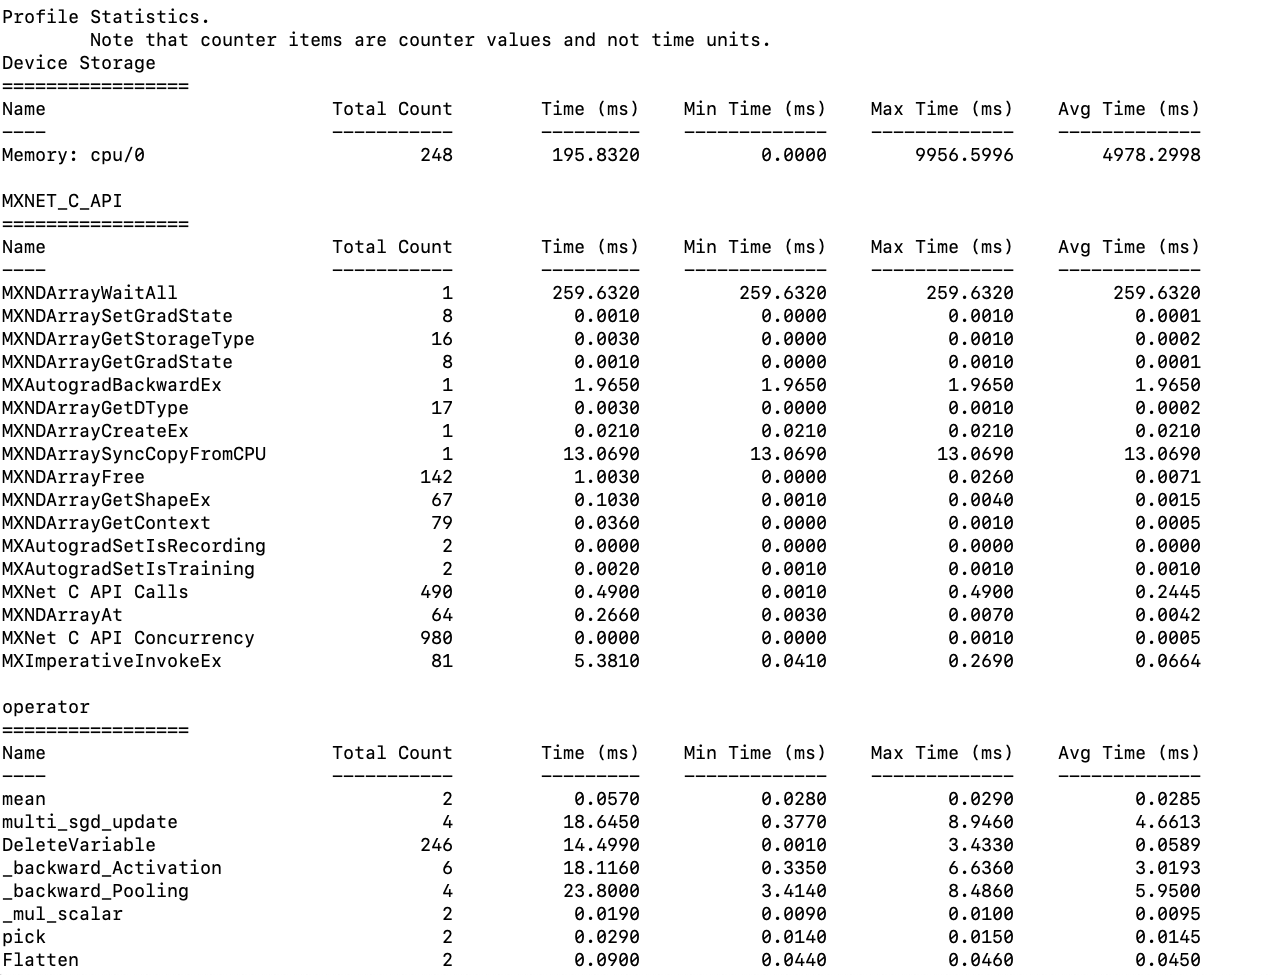
Currently, the profiler has a function called dumps() that will return the aggregate statistics, which include min, max, and average for entries in Device Memory, Operator, and C_API. The current return value is string and the data is presented in a table fashion (refer to the screenshot above). However, while the table is nicely formatted, it is only meant to be read by humans but is not easily parse-able otherwise by program. So, there is a need for an API that returns the same aggregate stats in a JSON string.
Specification
A new API, get_summary(), will be introduced. It will have two parameters:
- “sort_by” which specifies by which statistic should we sort the entries. It defaults to “avg” and valid options are [“min”, “max”, “avg”].
“ascending” which specifies how the entries should be sorted. It defaults to False and valid options are [True, False].
Expected use cases of
get_summary()include:If customers are more interested in some events or stats than the others, they can customize the data presentation to more efficiently monitor their models.
- Customers can easily pass the stats to automated performance tests or monitoring tools. They do not need to parse the table-like string returned by
dumps(). - This new API will be immediately useful to a new operator-level benchmark tool that @sandeep-krishnamurthy will work on. cwiki: https://cwiki.apache.org/confluence/display/MXNET/MXNet+Operator+Benchmarks.
The structure of the JSON return value is shown below. It is a four layer dictionary structure. The 1st layer is “Time”, “Memory”, and “Unit”. The 2nd layer is the category that the operators/APIs fall into. The 3rd layer is the operators/APIs. Finally, the 4th layer is the stats. Notice that the time unit is ms and the memory unit is byte.
{
    "Time": {
        "operator": {
            "mean ": {
                "Total Count": 2,
                "Total Time": 0.0490,
                "Min Time": 0.0240,
                "Max Time": 0.0250,
                "Avg Time": 0.0245
            }
            ...
        }
        ,
        "MXNET_C_API": {
            "MXNDArrayWaitAll": {
                "Total Count": 1,
                "Total Time": 205.9560,
                "Min Time": 205.9560,
                "Max Time": 205.9560,
                "Avg Time": 205.9560
            }
            ,
            "MXNDArraySetGradState": {
                "Total Count": 8,
                "Total Time": 0.0050,
                "Min Time": 0.0000,
                "Max Time": 0.0010,
                "Avg Time": 0.0006
            }
            ...
        }
    }
    ,
    "Memory": {
        "Device Storage": {
            "Memory: cpu/0 ": {
                "Count": 1,
                "Max Usage": 109037988,
                "Min Usage": 0,
                "Avg Usage": 54518999
            }
            ,
            "Memory: gpu/0 ": {
                "Count": 1,
                "Max Usage": 109037988,
                "Min Usage": 0,
                "Avg Usage": 54518999
            }
        }
        ,
        "Pool Memory": {
            "Pool:gpu/0 Pool Free": {
                "Count": 1,
                "Max Usage": 1,
                "Min Usage": 2,
                "Avg Usage": 3
            }
            ,
            "Pool:gpu/0 Pool Used": {
                "Count": 1,
                "Max Usage": 0,
                "Min Usage": 1,
                "Avg Usage": 2
            }
            ...
        }
    }
    "Unit": {
        "Time": "ms",
        "Memory": "byte"
    }
}
Asides from get_summary(), we will also have another new API, reset(), which will clear the aggregate statistics up until now. A typical use case is like:
# we don't care what happened before this point
profiler.reset()
# model
profiler.set_state('run')
run_training_iteration(*next(itr))
mx.nd.waitall()
profiler.set_state('stop')
# end model
func(profiler.get_summary())
In a more complex case, suppose we want to use the same profiler to benchmark various sections of a model, we can then call get_summary() and reset() at the end of each section or supposedly at the end of a loop neatly like:
# model section 1
profiler.set_state('run')
# model code here
profiler.set_state('stop')
print(profiler.get_summary())
profiler.reset()

# model section 2
profiler.set_state('run')
# model code here
profiler.set_state('stop')
func(profiler.get_summary())
profiler.reset()
OR
# loop through tests functions
for f in benchmark_tests:
    profiler.set_state('run')
    f()
    mx.nd.waitall()
    profiler.set_state('stop')
    print(profiler.get_summary())
    profiler.reset()
Fixing the Output of Dumps()
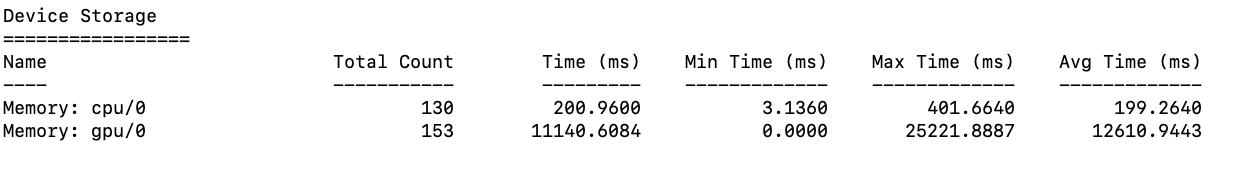
Currently labeling in the table is slightly off. For memory-related entries the labels should be “Usage” rather than “Time”. The “Time (ms)” column also does not make sense for memory entries, so it should be removed for memory entries.
The new table labeling should look like:
// For time entries
Name Total Count Total Time (ms) Min Time (ms) Max Time (ms) Avg Time (ms)
// For memory entries
Name Total Count Min Usage (MB) Max Usage (MB) Avg Usage (MB)
F&Q
- Why can't we use the current dumps() API?
We can use the current dumps API and basically get the save information, but then we need to manually parse the table which is not a good user experience.
- Why add a new profiler API
get_summary()in the back-end rather than a python parser utility that returns in JSON?
This is we can use this new API in different languages and make sure the return is consistent.
 ZhaoqiZhu
All 20 comments
Hey, this is the MXNet Label Bot.
Thank you for submitting the issue! I will try and suggest some labels so that the appropriate MXNet community members can help resolve it.
Here are my recommended labels: Feature
 mxnet-label-bot
on 25 May 2019
mxnet-label-bot
on 25 May 2019
Great proposal! I like that you implement this in the backend level to be able to expose it to various frontends.
So far, your design will return aggregated values. In some cases, people would also like to have the raw data to analyse it themselfes.
 marcoabreu
on 28 May 2019
marcoabreu
on 28 May 2019
I understand the value of getting the dump output in a different format compared to tabular form. This can also be useful for doing post-processing on the dumped output as required by new profiler features like these: https://github.com/apache/incubator-mxnet/pull/14973 . Having said that, I think of get_summary as similar to dumps but outputting a different format. In this sense, we don't need to add a new API but just add support format to existing API. For example:
def dumps(reset=False, format="table" or "json", sort_by=..)
 anirudh2290
on 28 May 2019
anirudh2290
on 28 May 2019
+1
 cjolivier01
on 29 May 2019
cjolivier01
on 29 May 2019
Why add a new profiler API get_summary() in the back-end rather than a python parser utility that returns in JSON?
This is we can use this new API in different languages and make sure the return is consistent.
I wasn't able to understand the answer for this question. @ZhaoqiZhu would you mind elaborate? I had the impression that there's no difference in the profiler dump file regardless of the frontend so I assumed that the later steps on analyzing the dump don't involve the front-end language anymore.
 szha
on 29 May 2019
szha
on 29 May 2019
I understand the value of getting the dump output in a different format compared to tabular form. This can also be useful for doing post-processing on the dumped output as required by new profiler features like these: #14973 . Having said that, I think of
get_summaryas similar todumpsbut outputting a different format. In this sense, we don't need to add a new API but just add support format to existing API. For example:def dumps(reset=False, format="table" or "json", sort_by=..)
My intension was to not change the existing APIs, but I can see your point. Do you think we need sorting for the tabular output though? @anirudh2290
 Zha0q1
on 29 May 2019
Zha0q1
on 29 May 2019
Why add a new profiler API get_summary() in the back-end rather than a python parser utility that returns in JSON?
This is we can use this new API in different languages and make sure the return is consistent.I wasn't able to understand the answer for this question. @ZhaoqiZhu would you mind elaborate? I had the impression that there's no difference in the profiler dump file regardless of the frontend so I assumed that the later steps on analyzing the dump don't involve the front-end language anymore.
Yes, the dump file is processed by the backend, but that's more for tracing. For aggregate information we currently only have dumps() which will return a tabular string. It prints out like this.
So instead of adding a utility that parse that table into a JSON string, we can return a JSON string from the backend directly.
Zha0q1
on 29 May 2019
sorting for the tabular output would be great to have! There is already an issue open for this: https://github.com/apache/incubator-mxnet/issues/14100
anirudh2290
on 29 May 2019
sorting for the tabular output would be great to have! There is already an issue open for this: #14100
Thanks for the link! I will update my proposal to reflect that tomorrow.
Zha0q1
on 29 May 2019
So instead of adding a utility that parse that table into a JSON string, we can return a JSON string from the backend directly.
What's the value proposition in doing that, especially given that the raw dump is already available.
szha
on 29 May 2019
So instead of adding a utility that parse that table into a JSON string, we can return a JSON string from the backend directly.
What's the value proposition in doing that, especially given that the raw dump is already available.
Raw dump gives the events but not the stats. Before, if a user is interested in programmatically process the stats, they must call dumps() and parse the table themselves. Here we are doing that for them
Zha0q1
on 29 May 2019
Yes, and a python script would do that nicely without involving other frontend (or mxnet). For example this one: https://github.com/TaoLv/mxProfileParser
What's the value addition of having that in the backend? Is it just for those who cannot use python?
szha
on 29 May 2019
@szha In case of the tool you mentioned it does the aggregation too. I think the use case that @Zha0q1 is trying to address is when one wants to directly obtain the aggregated JSON directly (to do some post-processing on it) without having to do additional work in the frontend language binding. And yes it can also be useful for other frontends.
anirudh2290
on 29 May 2019
I think there are multiple points:
- People are already using dumps() and we want to present the information in a way (json) that it is easier to use. The script is still outputting a table.
- Users may be interested in calling dumps() at multiple points within a model. With that python script they would need to call mx.nd.waitall(), start a new process to run the script, deal with synchronization, parse the script return. This can be as easy as calling dumps(format = 'json')
- With dumps() we can do reset. However if we process the raw dump, there it will be all then events since the start of the model
Zha0q1
on 29 May 2019
do you feel that aggregating raw profiler dumps is worth adding a new C API? to me, this aggregation doesn't seem like a core functionality of mxnet since it can be done outside of mxnet. we don't have a contrib namespace for C API so it needs to be right in one shot.
back to the use case:
People are already using dumps() and we want to present the information in a way (json) that it is easier to use. The script is still outputting a table.
With dumps() we can do reset. However if we process the raw dump, there it will be all then events since the start of the model
Adding ways for aggregation and filtering seem more principled.
Users may be interested in calling dumps() at multiple points within a model. With that python script they would need to call mx.nd.waitall()
I actually suspect that this is not a use case that should be supported. dumps() doesn't have a clear scope so there's not guarantee that the output has a scope of what users think it might have. This is especially the case for mxnet because of the asynchronous execution.
szha
on 30 May 2019
do you feel that aggregating raw profiler dumps is worth adding a new C API? to me, this aggregation doesn't seem like a core functionality of mxnet since it can be done outside of mxnet. we don't have a contrib namespace for C API so it needs to be right in one shot.
back to the use case:
People are already using dumps() and we want to present the information in a way (json) that it is easier to use. The script is still outputting a table.
With dumps() we can do reset. However if we process the raw dump, there it will be all then events since the start of the modelAdding ways for aggregation and filtering seem more principled.
Users may be interested in calling dumps() at multiple points within a model. With that python script they would need to call mx.nd.waitall()
I actually suspect that this is not a use case that should be supported.
dumps()doesn't have a clear scope so there's not guarantee that the output has a scope of what users think it might have. This is especially the case for mxnet because of the asynchronous execution.
I think now where I am headed for is to add parameters for return format, sort_by, and ascending like Anirudh suggested. That way we are not going to create new C APIs.
def dumps(reset=False, format="table" or "json", sort_by=..)
Zha0q1
on 30 May 2019
@sandeep-krishnamurthy we can close this now
Zha0q1
on 25 Jul 2019
optionally adding json output seems reasonable. during development of this feature, the intel folks were asking for more aggregation of the output, such as convolution ops for different input shapes, for instance, which seems perfectly fair (there’s a discussion issue about it somewhere). Anyway, whatever y’all decide to do, try to keep open the extensibility to stuff like that (which would lend itself more to json output than text output). However, I still think it’s important to have simple text output available if desired, since it gives a nice, clean one-look overview.
cjolivier01
on 25 Jul 2019
output was loosely based on pytorch, btw.
cjolivier01
on 25 Jul 2019
optionally adding json output seems reasonable. during development of this feature, the intel folks were asking for more aggregation of the output, such as convolution ops for different input shapes, for instance, which seems perfectly fair (there’s a discussion issue about it somewhere). Anyway, whatever y’all decide to do, try to keep open the extensibility to stuff like that (which would lend itself more to json output than text output). However, I still think it’s important to have simple text output available if desired, since it gives a nice, clean one-look overview.
Thanks for the tips! We have added support for sorting and json in this PR: https://github.com/apache/incubator-mxnet/pull/15132. Basically, we have added three new parameters to dumps, namely sort_by, ascending, and format by which you can control the aggregate stats output. We are keeping the old table view as it is clear to human; json format is intended for use cases where you want to parse the aggregate stats with a script
Zha0q1
on 25 Jul 2019
Related issues
 Zhaoyang-XU
·
3Comments
Zhaoyang-XU
·
3Comments
 GuilongZh
·
3Comments
GuilongZh
·
3Comments
 Fzz123
·
3Comments
Fzz123
·
3Comments
 sbodenstein
·
3Comments
sbodenstein
·
3Comments
 realbns2008
·
3Comments
realbns2008
·
3Comments
Most helpful comment
I think now where I am headed for is to add parameters for return format, sort_by, and ascending like Anirudh suggested. That way we are not going to create new C APIs.
def dumps(reset=False, format="table" or "json", sort_by=..)