Incubator-mxnet: How to visualise filters of MXNet model?
How to visualise filters of MXNet model like what has been done in keras - https://blog.keras.io/how-convolutional-neural-networks-see-the-world.html?
 lixiangchun
All 4 comments
Thanks for the reference. We have been working on enabling visualization of MXNet data in the TensorBoard. You can see the design proposal here: https://cwiki.apache.org/confluence/display/MXNET/Logging+MXNet+Data+for+Visualization+in+TensorBoard
After the PR is merged, this might be a good tutorial to write about how to use the visualization tool in MXNet.
 reminisce
on 6 Mar 2018
reminisce
on 6 Mar 2018
Hi this solution applies to the gluon framework. I am not sure if you want to visualize the weights or the output of the convolution for some input (the latter is what I usually do).
Assuming you have a model, in the forward call you can return more than the last layer and visualize them:
%pylab inline

import mxnet as mx
from mxnet import gluon, nd

class tNet(gluon.nn.HybridBlock):

    def __init__(self,**kwards):
        gluon.nn.HybridBlock.__init__(self,**kwards)

        with self.name_scope():

            self.layer1 = gluon.nn.Conv2D(12,kernel_size=3,padding=1)
            self.layer2 = gluon.nn.Conv2D(12,kernel_size=3,padding=1)

    def hybrid_forward(self,F,_input):

        out1 = self.layer1(_input)
        out2 = self.layer2(out1)

        return out1, out2
mynet = tNet()
mynet.initialize(mx.init.Xavier())
xx = nd.random_uniform(shape=[4,12,128,128])
out1, out2 = mynet(xx)
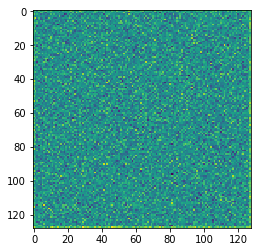
imshow(out1[0,0].asnumpy())
this produces the following image:
Now say you want to visualize the weights only of a layer, without the convolution. For example you can obtain the weights of self.layer2 or self.layer1 like this:
layer2_weight = mynet.layer2.weight.data() # This is an NDArray object
layer2_bias = mynet.layer2.bias.data() # similarly, the bias terms, NDArray object
mynet.layer2.weight.data().shape
# prints (12,12,3,3) for this particular example.
so you can create histograms etc. Hope this helps.
 feevos
on 22 Mar 2018
feevos
on 22 Mar 2018
We have open-sourced MXBoard which enables users to visualize MXNet data (including network structures) in TensorBoard. In your case, you can just simply pass the weights/filters to the logging API and view it in TensorBoard.
The current version on PyPI is 0.1.0rc3. You can either install from source or pip install. The GitHub site has rich examples and tutorials on installation and how to use it in MXNet. Could you try it and give us feedbacks? Thanks.
reminisce
on 30 Mar 2018
@sandeep-krishnamurthy good answer on this, so good to close. thanks!
 thomelane
on 12 Jul 2018
thomelane
on 12 Jul 2018
Related issues
 GuilongZh
·
3Comments
GuilongZh
·
3Comments
 Zhaoyang-XU
·
3Comments
Zhaoyang-XU
·
3Comments
 xzqjack
·
3Comments
xzqjack
·
3Comments
 qiliux
·
3Comments
qiliux
·
3Comments
 dushoufu
·
3Comments
dushoufu
·
3Comments
Most helpful comment
We have open-sourced MXBoard which enables users to visualize MXNet data (including network structures) in TensorBoard. In your case, you can just simply pass the weights/filters to the logging API and view it in TensorBoard.
The current version on PyPI is 0.1.0rc3. You can either install from source or
pip install. The GitHub site has rich examples and tutorials on installation and how to use it in MXNet. Could you try it and give us feedbacks? Thanks.