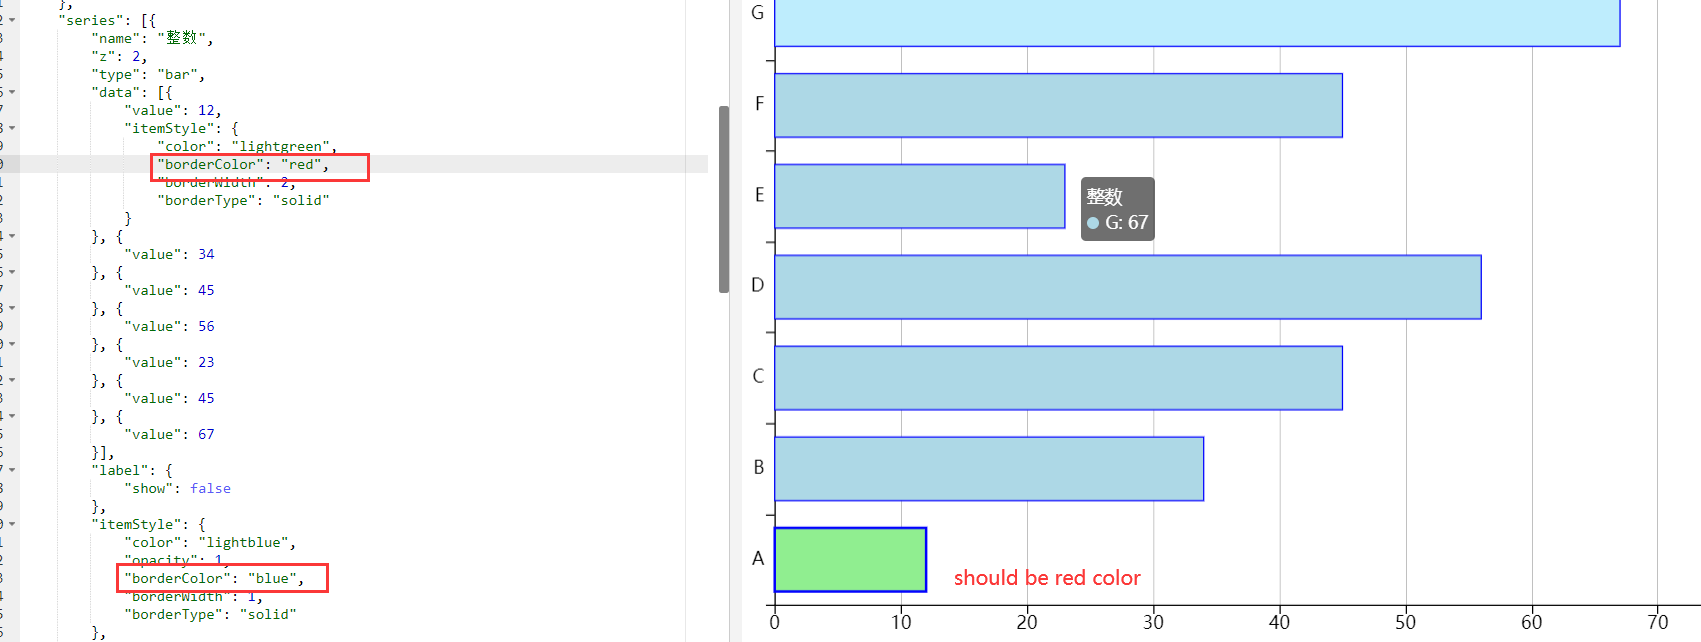
Incubator-echarts: The data point item style [borderColor] should has higher priority than series item style [borderColor]
Version
4.7.0
Steps to reproduce
Please use this option as following to reproduce the issue.
option = {
"animation": true,
"backgroundColor": "#FFFFFF",
"tooltip": {
"trigger": "item"
},
"title": null,
"legend": {
"show": true,
"orient": "vertical",
"align": "left",
"backgroundColor": "transparent",
"borderColor": "transparent",
"borderWidth": 1,
"borderType": "solid",
"textStyle": {
"color": "#000000",
"fontFamily": "'Microsoft YaHei'",
"fontSize": 14.67,
"fontStyle": "Normal",
"fontWeight": 400
},
"data": [{
"name": "整数",
"icon": "roundRect"
}],
"right": 5,
"top": "center",
"itemWidth": 14,
"itemGap": 11.73599853515625
},
"series": [{
"name": "整数",
"z": 2,
"type": "bar",
"data": [{
"value": 12,
"itemStyle": {
"color": "lightgreen",
"borderColor": "red",
"borderWidth": 2,
"borderType": "solid"
}
}, {
"value": 34
}, {
"value": 45
}, {
"value": 56
}, {
"value": 23
}, {
"value": 45
}, {
"value": 67
}],
"label": {
"show": false
},
"itemStyle": {
"color": "lightblue",
"opacity": 1,
"borderColor": "blue",
"borderWidth": 1,
"borderType": "solid"
},
"barGap": 0,
"barCategoryGap": "30%"
}],
"xAxis": {
"show": true,
"type": "value",
"axisLine": {
"show": true,
"lineStyle": {
"color": "#000000",
"width": 1,
"type": "solid"
}
},
"axisTick": {
"show": true,
"inside": false,
"length": 7,
"lineStyle": {
"color": "#000000",
"width": 1
}
},
"axisLabel": {
"show": true,
"rotate": 0,
"textStyle": {
"color": "#000000",
"fontFamily": "'Microsoft YaHei'",
"fontSize": 14.67,
"fontStyle": "Normal",
"fontWeight": 400
}
},
"splitLine": {
"show": true,
"lineStyle": {
"color": "#868686",
"width": 0.5,
"type": "solid"
}
},
"max": 80,
"min": 0,
"splitNumber": 8,
"boundaryGap": true
},
"yAxis": {
"show": true,
"type": "category",
"axisLine": {
"show": true,
"lineStyle": {
"color": "#000000",
"width": 1,
"type": "solid"
}
},
"axisTick": {
"show": true,
"inside": false,
"length": 7,
"lineStyle": {
"color": "#000000",
"width": 1
}
},
"axisLabel": {
"show": true,
"rotate": 0,
"textStyle": {
"color": "#000000",
"fontFamily": "'Microsoft YaHei'",
"fontSize": 14.67,
"fontStyle": "Normal",
"fontWeight": 400
}
},
"splitLine": {
"show": false
},
"data": ["A", "B", "C", "D", "E", "F", "G"]
},
"grid": {
"left": 26.1744,
"top": 15.335,
"right": 68.34,
"bottom": 29.67,
"backgroundColor": "transparent",
"borderWidth": 1,
"borderColor": "transparent",
"borderType": "solid",
"show": true
},
"color": null
};
What is expected?
The data point A should has red border
What is actually happening?
The data point A has blue border
 katherinebai
All 6 comments
Hi! We've received your issue and please be patient to get responded. 🎉
The average response time is expected to be within one day for weekdays.
In the meanwhile, please make sure that you have posted enough image to demo your request. You may also check out the API and chart option to get the answer.
If you don't get helped for a long time (over a week) or have an urgent question to ask, you may also send an email to [email protected]. Please attach the issue link if it's a technical questions.
If you are interested in the project, you may also subscribe our mail list.
Have a nice day! 🍵
![echarts-bot[bot] picture](https://avatars1.githubusercontent.com/in/20872?v=4&s=40) echarts-bot[bot]
on 7 Aug 2020
echarts-bot[bot]
on 7 Aug 2020
This has been fixed in 5.0.
 plainheart
on 7 Aug 2020
plainheart
on 7 Aug 2020
This has been fixed in 5.0.
Could you provide that when will release v5.0? Thank you very much.
katherinebai
on 10 Aug 2020
5.0-alpha is now available, you can refer to the GitHub release page. And the stable release will be published in the late of September.
plainheart
on 10 Aug 2020
@plainheart This is very helpful to me, but charts is a basic library for us, and the release date doesn't allow us to wait until the end of September to change libraries.Can you tell us the commit or source file of this bug fix so that we can make manual changes, thank you very much !
 li-zhixin
on 10 Aug 2020
li-zhixin
on 10 Aug 2020
@li-zhixin Of course, I'm sorry for this. It can be fixed easily, just modify this line of code as follows.
var stroke = data.getItemVisual(dataIndex, 'borderColor');
Related issues
 akvaliya
·
3Comments
akvaliya
·
3Comments
 liuqz
·
3Comments
liuqz
·
3Comments
 kirazxyun
·
3Comments
kirazxyun
·
3Comments
 yj20060714
·
3Comments
yj20060714
·
3Comments
 Zendic
·
3Comments
Zendic
·
3Comments
Most helpful comment
@li-zhixin Of course, I'm sorry for this. It can be fixed easily, just modify this line of code as follows.