Incubator-echarts: toolbox optionToContent 自定义 dataView,点刷新,optionToContent回调中拿到的series数据遗失
Version
4.8.0
Steps to reproduce
1、在ECharts 的示例代码 https://echarts.apache.org/examples/zh/editor.html?c=line-marker,填入下面代码(optionToContent为官网文档中的)
option = {
    title: {
        text: '未来一周气温变化',
        subtext: '纯属虚构'
    },
    tooltip: {
        trigger: 'axis'
    },
    legend: {
        data: ['最高气温', '最低气温']
    },
    toolbox: {
        show: true,
        feature: {
            dataZoom: {
                yAxisIndex: 'none'
            },
            dataView: {
                readOnly: false,
                optionToContent: function(opt) {
                    console.log(opt)
                    var axisData = opt.xAxis[0].data;
                    var series = opt.series;
                    var table = '<table style="width:100%;text-align:center"><tbody><tr>' +
                        '<td>时间</td>' +
                        '<td>' + series[0].name + '</td>' +
                        '<td>' + series[1].name + '</td>' +
                        '</tr>';
                    for (var i = 0, l = axisData.length; i < l; i++) {
                        table += '<tr>' +
                            '<td>' + axisData[i] + '</td>' +
                            '<td>' + series[0].data[i] + '</td>' +
                            '<td>' + series[1].data[i] + '</td>' +
                            '</tr>';
                    }
                    table += '</tbody></table>';
                    return table;
                }

            },
            magicType: {
                type: ['line', 'bar']
            },
            restore: {},
            saveAsImage: {}
        }
    },
    xAxis: {
        type: 'category',
        boundaryGap: false,
        data: ['周一', '周二', '周三', '周四', '周五', '周六', '周日']
    },
    yAxis: {
        type: 'value',
        axisLabel: {
            formatter: '{value} °C'
        }
    },
    series: [{
            name: '最高气温',
            type: 'line',
            data: [11, 11, 15, 13, 12, 13, 10],
            markPoint: {
                data: [{
                        type: 'max',
                        name: '最大值'
                    },
                    {
                        type: 'min',
                        name: '最小值'
                    }
                ]
            },
            markLine: {
                data: [{
                    type: 'average',
                    name: '平均值'
                }]
            }
        },
        {
            name: '最低气温',
            type: 'line',
            data: [1, -2, 2, 5, 3, 2, 0],
            markPoint: {
                data: [{
                    name: '周最低',
                    value: -2,
                    xAxis: 1,
                    yAxis: -1.5
                }]
            },
            markLine: {
                data: [{
                        type: 'average',
                        name: '平均值'
                    },
                    [{
                        symbol: 'none',
                        x: '90%',
                        yAxis: 'max'
                    }, {
                        symbol: 'circle',
                        label: {
                            position: 'start',
                            formatter: '最大值'
                        },
                        type: 'max',
                        name: '最高点'
                    }]
                ]
            }
        }
    ]
};
2、点击图表上方“数据视图”图标,切换数据视图;
3、点击数据视图下方“刷新”按钮;
4、(问题出现)会到折线图视图,但此时只有一条曲线,曲线图少了一个系列;
5、(问题出现)若此时再点击切换到数据视图,可发现上面自定义数据视图table第二列数据全为undefined;
What is expected?
自定义视图,和默认的 textarea 一样,点击刷新后会到图表视图,数据不发生错误,或者可隐藏刷新按钮
What is actually happening?
使用optionToContent 自定义 dataView,点击刷新按钮后,数据出现遗失,且底部按钮无法隐藏,缺少回调函数
 meggiepeng
All 5 comments
Hi! We've received your issue and please be patient to get responded. 🎉
The average response time is expected to be within one day for weekdays.
In the meanwhile, please make sure that you have posted enough image to demo your request. You may also check out the API and chart option to get the answer.
If you don't get helped for a long time (over a week) or have an urgent question to ask, you may also send an email to [email protected]. Please attach the issue link if it's a technical questions.
If you are interested in the project, you may also subscribe our mail list.
Have a nice day! 🍵
![echarts-bot[bot] picture](https://avatars1.githubusercontent.com/in/20872?v=4&s=40) echarts-bot[bot]
on 28 Jul 2020
echarts-bot[bot]
on 28 Jul 2020
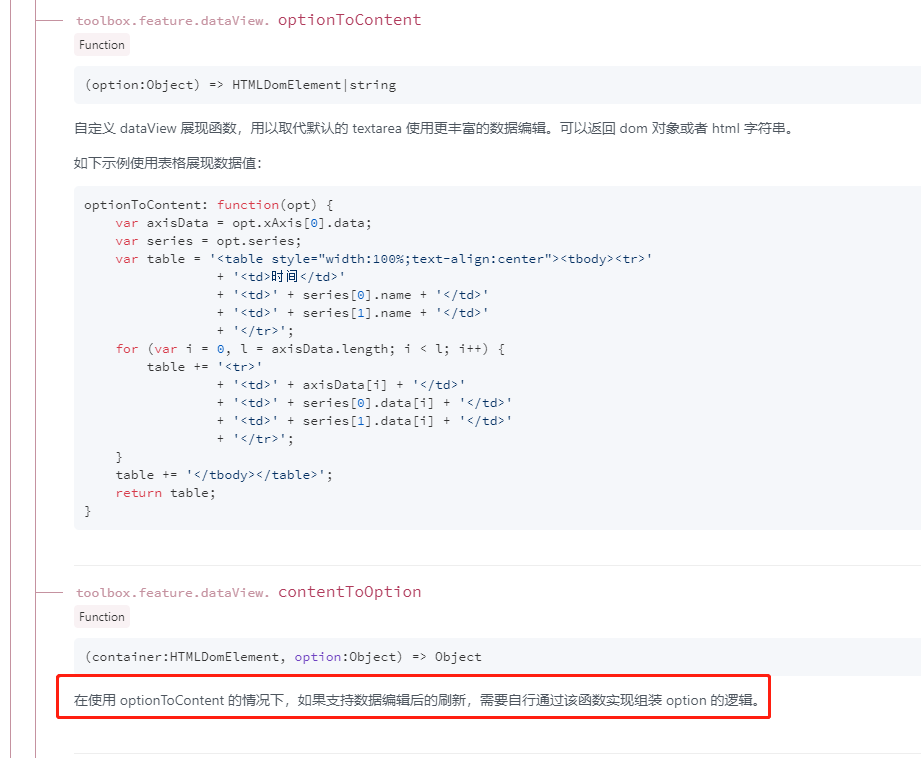
如果使用了自定义 optionToContent 逻辑,相应地,还需要配置自定义的 contentToOption 自行封装 option 逻辑,从而支持“刷新”操作。
 plainheart
on 28 Jul 2020
plainheart
on 28 Jul 2020
的确如 @plainheart 所说,实际上 optionToContent 和 contentToOption 是必须配对使用的,而在你的例子中你只使用了 optionToContent 而没有使用 contentToOption,使得点击“刷新”时获取不到最新的 dataView 转化而成的 option,因此丢失了一条数据。再往后的一列 undefined 也是相同原因所致。
修改方法
添加 contentToOption 方法。鉴于你给的例子是一个纯输出的 HTML Table (只读),因此实际上直接 return options 即可,如下:
(另外我发现,只要你添加了 contentToOption 方法,即使不写 return 也能工作,但没有这个方法就不行)
option = {
    title: {
        text: '未来一周气温变化',
        subtext: '纯属虚构'
    },
    tooltip: {
        trigger: 'axis'
    },
    legend: {
        data: ['最高气温', '最低气温']
    },
    toolbox: {
        show: true,
        feature: {
            dataZoom: {
                yAxisIndex: 'none'
            },
            dataView: {
                readOnly: false,
                optionToContent: function(opt) {
                    var axisData = opt.xAxis[0].data;
                    var series = opt.series;
                    var table = '<table style="width:100%;text-align:center"><tbody><tr>' +
                        '<td>时间</td>' +
                        '<td>' + series[0].name + '</td>' +
                        '<td>' + series[1].name + '</td>' +
                        '</tr>';
                    for (var i = 0, l = axisData.length; i < l; i++) {
                        table += '<tr>' +
                            '<td>' + axisData[i] + '</td>' +
                            '<td>' + series[0].data[i] + '</td>' +
                            '<td>' + series[1].data[i] + '</td>' +
                            '</tr>';
                    }
                    table += '</tbody></table>';
                    return table;
                },
+               contentToOption: function(container, options) {
+                   return options;
+               }

            },
            magicType: {
                type: ['line', 'bar']
            },
            restore: {},
            saveAsImage: {}
        }
    },
    xAxis: {
        type: 'category',
        boundaryGap: false,
        data: ['周一', '周二', '周三', '周四', '周五', '周六', '周日']
    },
    yAxis: {
        type: 'value',
        axisLabel: {
            formatter: '{value} °C'
        }
    },
    series: [{
            name: '最高气温',
            type: 'line',
            data: [11, 11, 15, 13, 12, 13, 10],
            markPoint: {
                data: [{
                        type: 'max',
                        name: '最大值'
                    },
                    {
                        type: 'min',
                        name: '最小值'
                    }
                ]
            },
            markLine: {
                data: [{
                    type: 'average',
                    name: '平均值'
                }]
            }
        },
        {
            name: '最低气温',
            type: 'line',
            data: [1, -2, 2, 5, 3, 2, 0],
            markPoint: {
                data: [{
                    name: '周最低',
                    value: -2,
                    xAxis: 1,
                    yAxis: -1.5
                }]
            },
            markLine: {
                data: [{
                        type: 'average',
                        name: '平均值'
                    },
                    [{
                        symbol: 'none',
                        x: '90%',
                        yAxis: 'max'
                    }, {
                        symbol: 'circle',
                        label: {
                            position: 'start',
                            formatter: '最大值'
                        },
                        type: 'max',
                        name: '最高点'
                    }]
                ]
            }
        }
    ]
}
 easonyq
on 6 Aug 2020
easonyq
on 6 Aug 2020
@plainheart
如果认为是使用者使用错误(没有设定 contentToOption 方法)导致了该问题,那么可以关闭这个 issue。
如果认为即便在使用者没有设定该方法时仍然应当容错,我可以提交一个 PR 进行这个修改。
easonyq
on 6 Aug 2020
谢谢,问题已解决。(如果没有设定contentToOption方法时也能容错就更好了)
meggiepeng
on 6 Aug 2020
Related issues
 kirazxyun
·
3Comments
kirazxyun
·
3Comments
 yj20060714
·
3Comments
yj20060714
·
3Comments
 publisherfk
·
3Comments
publisherfk
·
3Comments
 decadef20
·
3Comments
decadef20
·
3Comments
 Zendic
·
3Comments
Zendic
·
3Comments