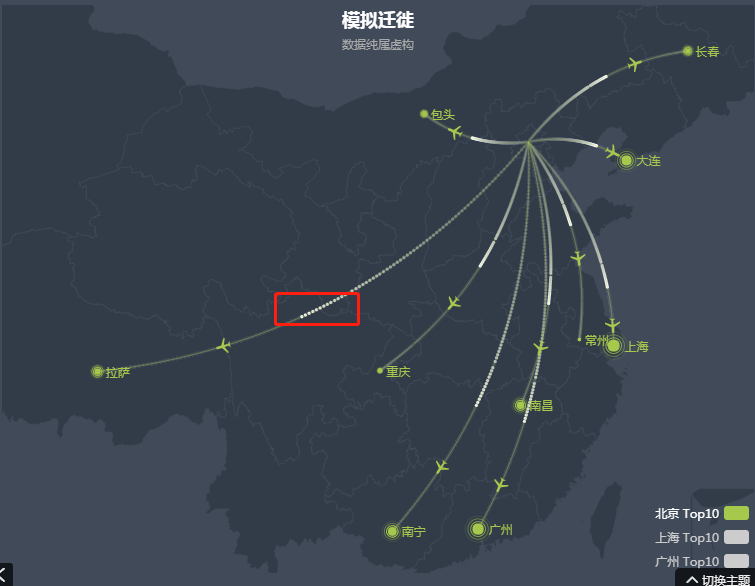
Incubator-echarts: 地图迁徙图,线的绘制问题
Version
4.3.0
Steps to reproduce
series.push({
        name: item[0]   ' Top10',
        type: 'lines',
        zlevel: 1,
        effect: {
            show: true,
            period: 1, // 此处时间调短,距离越长的线,渲染成了点点点
            trailLength: 0.7,
            color: '#fff',
            symbolSize: 3
        },
        lineStyle: {
            normal: {
                color: color[i],
                width: 0,
                curveness: 0.2
            }
        },
        data: convertData(item[1])
    },
What is expected?
不要出现点点点, 就是正常的线。
What is actually happening?
出现了点点点
 liyunying
All 14 comments
Hi! We've received your issue and please be patient to get responded. 🎉
The average response time is expected to be within one day for weekdays.
In the meanwhile, please make sure that you have posted enough image to demo your request. You may also check out the API and chart option to get the answer.
If you don't get helped for a long time (over a week) or have an urgent question to ask, you may also send an email to [email protected]. Please attach the issue link if it's a technical questions.
If you are interested in the project, you may also subscribe our mail list.
Have a nice day! 🍵
![echarts-bot[bot] picture](https://avatars1.githubusercontent.com/in/20872?v=4&s=40) echarts-bot[bot]
on 29 Nov 2019
echarts-bot[bot]
on 29 Nov 2019
这个可能是因为卡顿跳帧造成的,可以把速度调得慢一点试试
 pissang
on 29 Nov 2019
pissang
on 29 Nov 2019
@pissang 就是想要快一点的效果,攻击线如果太慢了就没有攻击的视觉效果了。
liyunying
on 29 Nov 2019
@liyunying 理解,可以优化一下
pissang
on 2 Dec 2019
@pissang 这个是等官方优化?还是说我这边可以进行优化?如何优化?
liyunying
on 2 Dec 2019
这个可能得把原来点动画,改为渐变线的动画效果,我可以去调查下 @pissang
 alex2wong
on 3 Dec 2019
alex2wong
on 3 Dec 2019
@alex2wong 您好,如果有好的解决方案,请告知。谢谢。
liyunying
on 4 Dec 2019
@alex2wong 赞!
我想的方案是每次绘制的时候不是绘制一个离散的点,而是绘制从上一个位置到新的位置的线段,这样就不会出现间断了
pissang
on 4 Dec 2019
类似问题 #9771 #8059
@pissang 是的,思路确实如此。用线段替代离散点,这个不用改Echarts,用一个offscreen canvas 事先缓存一个线段作为自定义symbol 即可。
这个策略针对移动端渲染弱的问题也有一定帮助,在iPhone X 和huawei P20 pro 上测试,也没有断点。当然要限定在一定zoom 内,zoomIn 太深,也会看到断点
详细代码参考:
https://github.com/alex2wong/incubator-echarts/commit/a22b57b04527f37bfd93129d4079db4a06f7de26
alex2wong
on 5 Dec 2019
@pissang 有个问题请教下,
                var symHeight = 20, symWidth = 4;
                symCanv.height = symHeight;
                symCanv.width = symWidth;
                var linePattern = symCtx.createLinearGradient(0,0,0,symHeight);
                linePattern.addColorStop(0, 'rgba(255,255,255,.4)');
                linePattern.addColorStop(1, 'rgba(255,255,255,0)');
                symCtx.strokeStyle = linePattern;
                symCtx.lineWidth = symWidth;
                symCtx.beginPath();
               // even if draw half of canvas height.
                symCtx.moveTo(symWidth/2, symHeight/2);
                symCtx.lineTo(symWidth/2,symHeight);

事先画的这个symbol 是20pix 高,如果Echart 内部渲染这个symbol 是严格按照中心去draw这个image,为什么在symbol 抵达endPoint的时候还突出去半截呢?我在画这个symbol的时候只画了下半截
alex2wong
on 6 Dec 2019
@alex2wong 我看了下,应该是因为 symbol 设置的格式有点问题,所以还是用的白色方块绘制。
图片的 symbol 应该设置为
symbol: 'image://' + lineSymbol
我试了下这样应该就没问题了。
pissang
on 9 Dec 2019
这个 work around 做法,有必要加到 symbol 的几个内建类型里去吗?还是说由用户去控制这个自定义 image 呢 @pissang
alex2wong
on 11 Dec 2019
@alex2wong 感觉作为内置的一个 symbol 类型(暂时没想好是啥名字...)
然后需要在你的基础上优化一下,现在是固定的长度,最好是取上一个位置到这一个位置的长度,相当于把上一个位置和这一个位置连接起来了。
我划到 4.8.0 版本里了(一月底发布),@alex2wong 你看下是否有时间能够提一个 PR 😄
pissang
on 12 Dec 2019
sure, working on it. 刚看到 effectLineProto.updateSymbolPosition 这个函数,还没仔细debug。我估计得为每条线创建单独的 offscreen canvas 去画不同长度的方块 symbol,所以我在想如果有几百条线,会不会有性能问题?我先试试看 : )
alex2wong
on 16 Dec 2019
Related issues
 771752687
·
3Comments
771752687
·
3Comments
 shikelong
·
3Comments
shikelong
·
3Comments
 jarben
·
3Comments
jarben
·
3Comments
 antorman
·
3Comments
antorman
·
3Comments
 akvaliya
·
3Comments
akvaliya
·
3Comments
Most helpful comment
类似问题 #9771 #8059
@pissang 是的,思路确实如此。用线段替代离散点,这个不用改Echarts,用一个offscreen canvas 事先缓存一个线段作为自定义symbol 即可。
这个策略针对移动端渲染弱的问题也有一定帮助,在iPhone X 和huawei P20 pro 上测试,也没有断点。当然要限定在一定zoom 内,zoomIn 太深,也会看到断点
详细代码参考:
https://github.com/alex2wong/incubator-echarts/commit/a22b57b04527f37bfd93129d4079db4a06f7de26