Incubator-echarts: 太长的图表,使用折线图显示不完整
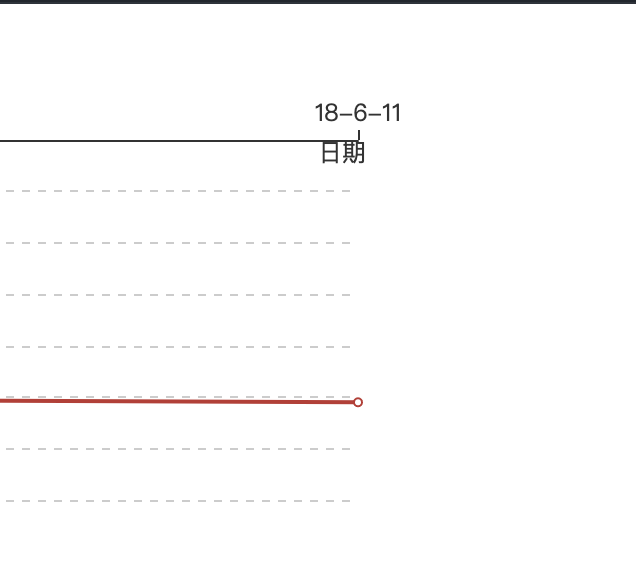
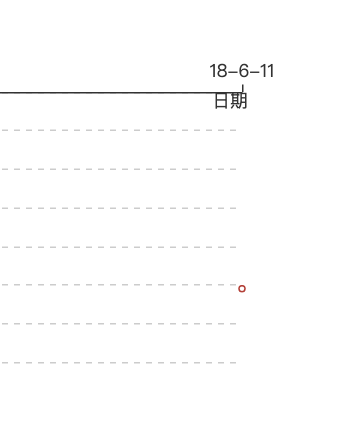
数据项超过4000,图表长度超过18000像素,折线图后面的部分只显示数据点,没有用折现连接起来,我改用柱状图则可以显示 . 测试发现和数据数量没关系,容器太长就无法展示,例子在这里 https://jsfiddle.net/longkas/0d28tkbe/1/ ,可以看到最后的数据点没有连起来
 Archieeeeee
All 5 comments
看起来像是 bug
 Ovilia
on 8 Oct 2019
Ovilia
on 8 Oct 2019
@Archieeeeee @Ovilia 未能重现,显示的好好的。
macOS 10.14.6 Chrome 77
 SevenOutman
on 12 Oct 2019
SevenOutman
on 12 Oct 2019
我这边可以复现
Ovilia
on 14 Oct 2019
@Archieeeeee 此问题看起来是一个 chrome 浏览器的 bug,以下有一段代码,在 chrome 和 safari 表现情况不一样,理论上最后连线应该与矩形边框相交,但在 chrome 下会被截断
        <canvas id="canvas" width="19602" height="1378" style="position: absolute; left: 0px; top: 0px; width: 9801px; height: 689px; user-select: none; -webkit-tap-highlight-color: rgba(0, 0, 0, 0); padding: 0px; margin: 0px; border-width: 0px;"></canvas>
        <script>
            var points = [[980,0],[8820,274]];
            var canvas = document.getElementById("canvas");
            var context = canvas.getContext("2d");//得到绘图的上下文环境
            context.beginPath();
            context.setTransform(2, 0, 0, 2, 0, 0);
            context.rect(980.1, 0, 7839.9, 274);
            // 以下代码打开即为正常
            // context.rect(980, 0, 7840, 274);
            context.clip();
            context.moveTo(points[0][0], points[0][1]);
            for (let i = 1; i < points.length; i++) {
                const element = points[i];
                context.lineTo(element[0], element[1]);
            }
            context.strokeStyle = "black";
            context.stroke();
        </script>
 zhanfang
on 9 Mar 2020
zhanfang
on 9 Mar 2020
👍2
Echarts can fix the clipPath size to adapt chrome feature.
src/chart/helper/createClipPathFromCoordSys.js
function createGridClipPath(...) {
    x -= lineWidth / 2;
    y -= lineWidth / 2;
    width += lineWidth;
    height += lineWidth;

    x = Math.floor(x);
    width = Math.round(width);
}
Was this page helpful?
0 / 5 - 0 ratings
Related issues
 wm370857724
·
3Comments
wm370857724
·
3Comments
 kirazxyun
·
3Comments
kirazxyun
·
3Comments
 771752687
·
3Comments
771752687
·
3Comments
 jarben
·
3Comments
jarben
·
3Comments
 shikelong
·
3Comments
shikelong
·
3Comments
Most helpful comment
@Archieeeeee 此问题看起来是一个 chrome 浏览器的 bug,以下有一段代码,在 chrome 和 safari 表现情况不一样,理论上最后连线应该与矩形边框相交,但在 chrome 下会被截断