Incubator-echarts: echarts.connect is broken when a chart with multiple series is linked with a chart with single series
Version
4.2.1
Reproduction link
https://jsfiddle.net/3jw7xyqf/
Steps to reproduce
Create a single graph with multiple series and enable legend on it
Create multiple graphs with a single series
Link them with echarts.connect
browse the code and try to hide the first element from a graph with multiple series
What is expected?
Graphs should be connected
What is actually happening?
The first graph is disconnected
Working example:
http://twitterwatcher.com - try to hide negative tweets and observe the behaviour on the rest of the graphs.
 lwedel
All 11 comments
Hi! We've received your issue and please be patient to get responded. 🎉
The average response time is expected to be within one day for weekdays.
In the meanwhile, please make sure that you have posted enough image to demo your request. You may also check out the API and chart option to get the answer.
If you don't get helped for a long time (over a week) or have an urgent question to ask, you may also send an email to [email protected] .
If you are interested in the project, you may also subscribe our mail list.
Have a nice day! 🍵
![echarts-bot[bot] picture](https://avatars1.githubusercontent.com/in/20872?v=4&s=40) echarts-bot[bot]
on 30 Aug 2019
echarts-bot[bot]
on 30 Aug 2019
You may need to add legend: {data: ["C"], top: '17%'} to option2. echarts.connect needs the same legend[i].name and series[i].name.
 yufeng04
on 1 Sep 2019
yufeng04
on 1 Sep 2019
@yufeng04 - this is not fixing the issue - unfortunately.
see here: https://jsfiddle.net/hm2L6gse/
lwedel
on 1 Sep 2019
Can you be more specific on what's expected? In your demo, which series are expected to connect?
 Ovilia
on 2 Sep 2019
Ovilia
on 2 Sep 2019
@Ovilia sure!
Current status:
- After de-selecting first (A) of the items from the legend on chart1
- The charts are disconnected - The tooltip is displayed only on chart1
Expected:
- After de-selecting first (A) of the items from the legend on chart1
- The charts are still connected - The tooltip is displayed on all of the charts
Hope that clears it up a little!
lwedel
on 2 Sep 2019
Any news on the above?
lwedel
on 5 Sep 2019
This seems to be a bug of connect.
Ovilia
on 6 Sep 2019
Hi,
Is there any news with this bug?
lwedel
on 26 Oct 2019
Provide some info about this issue:
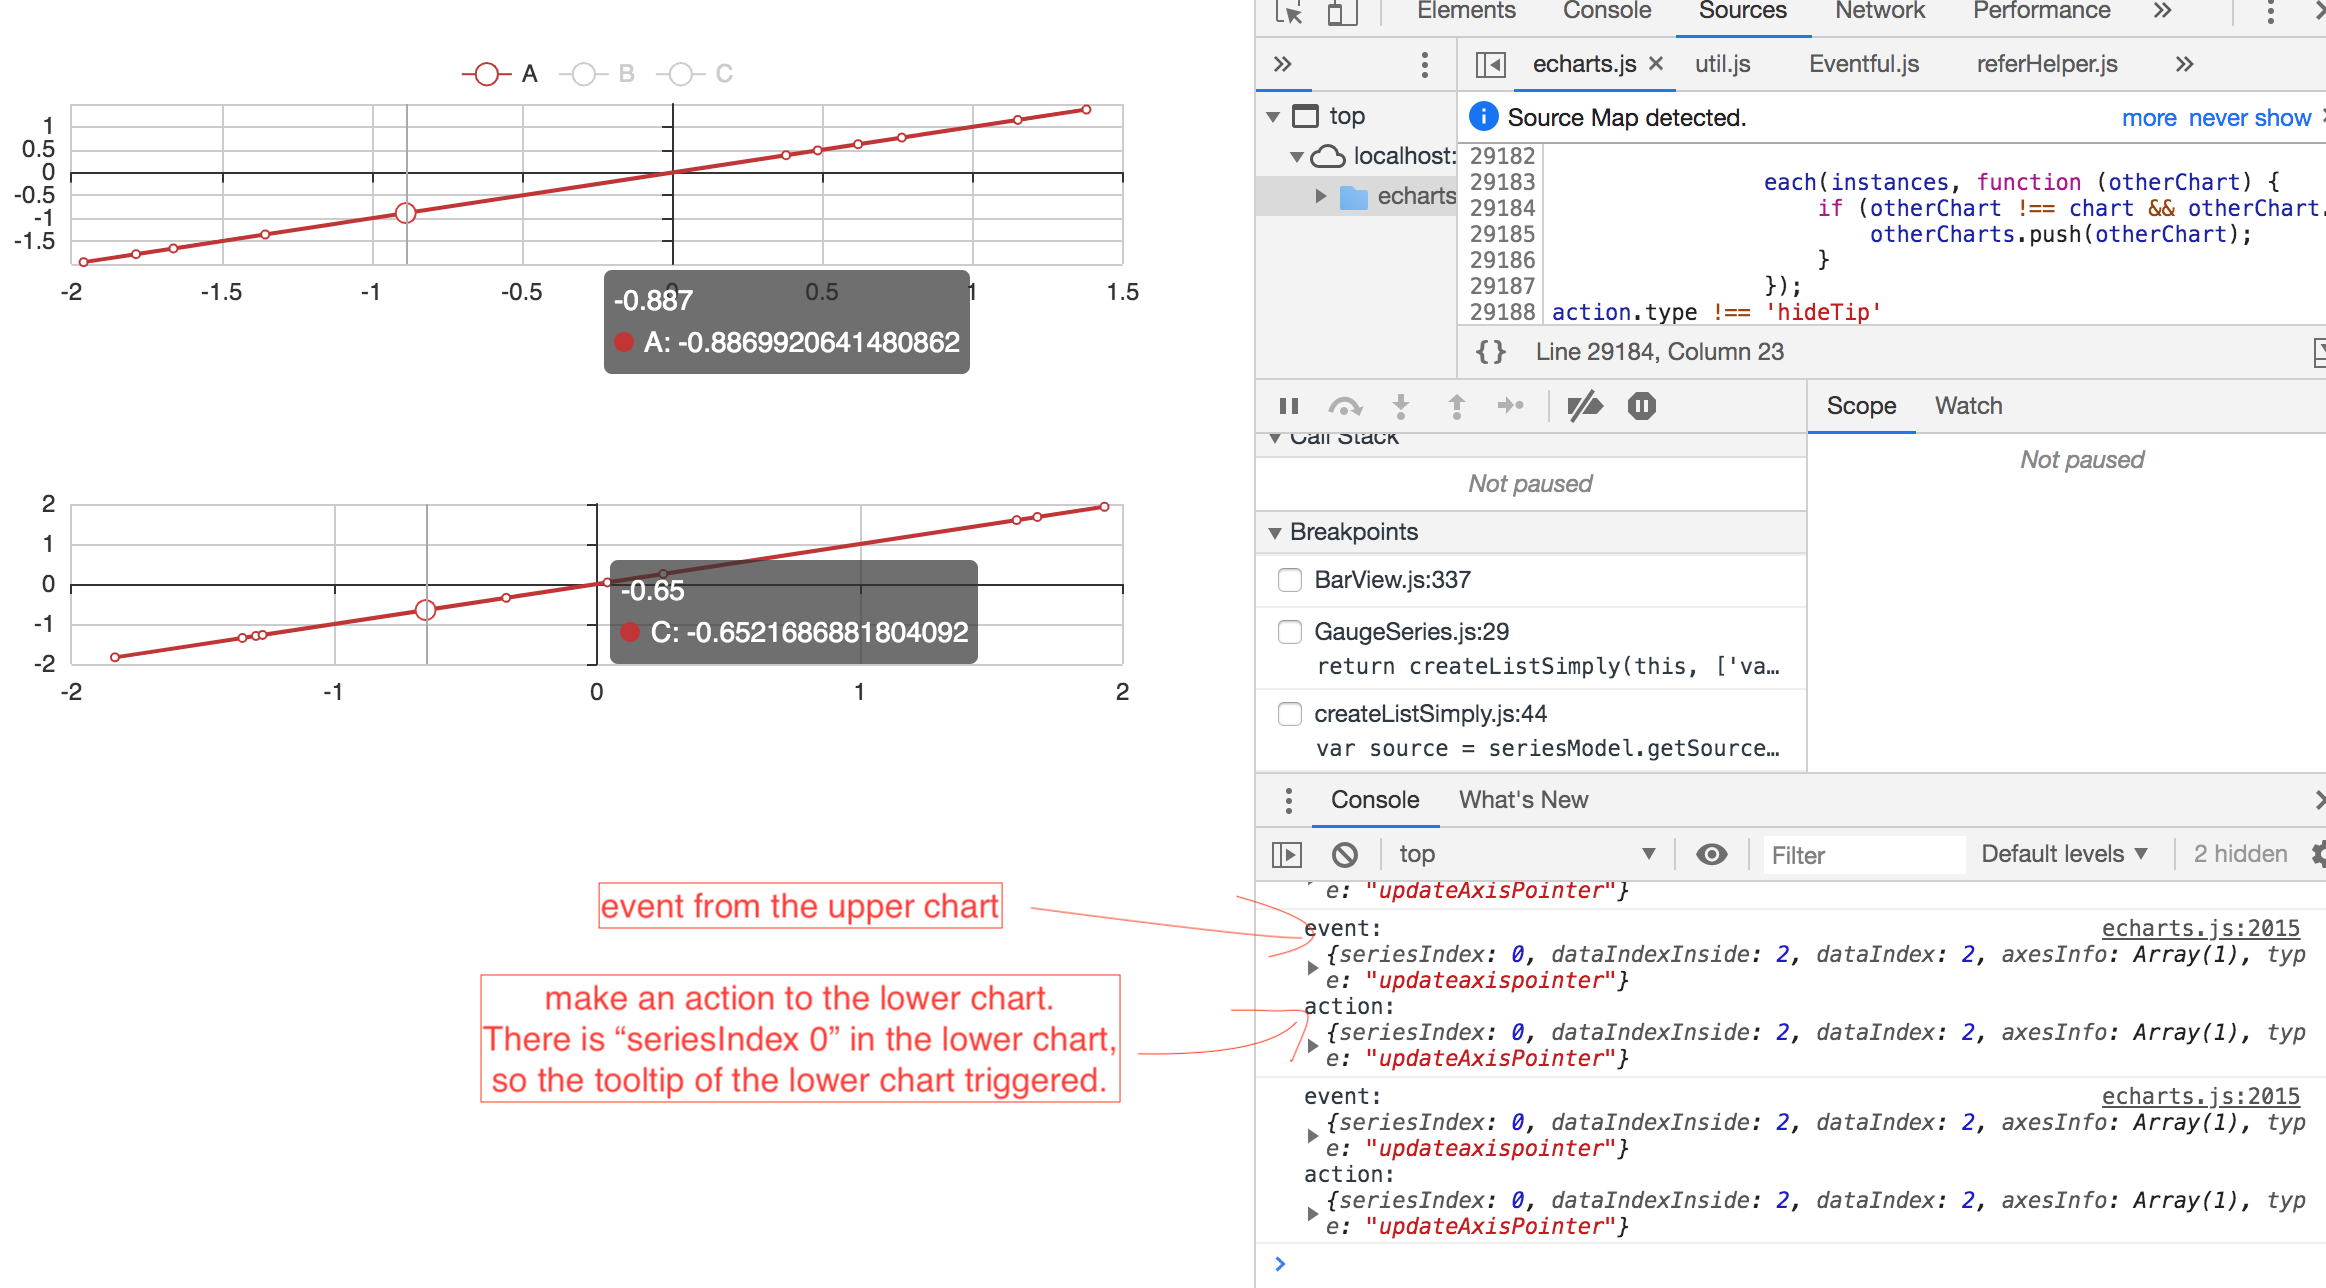
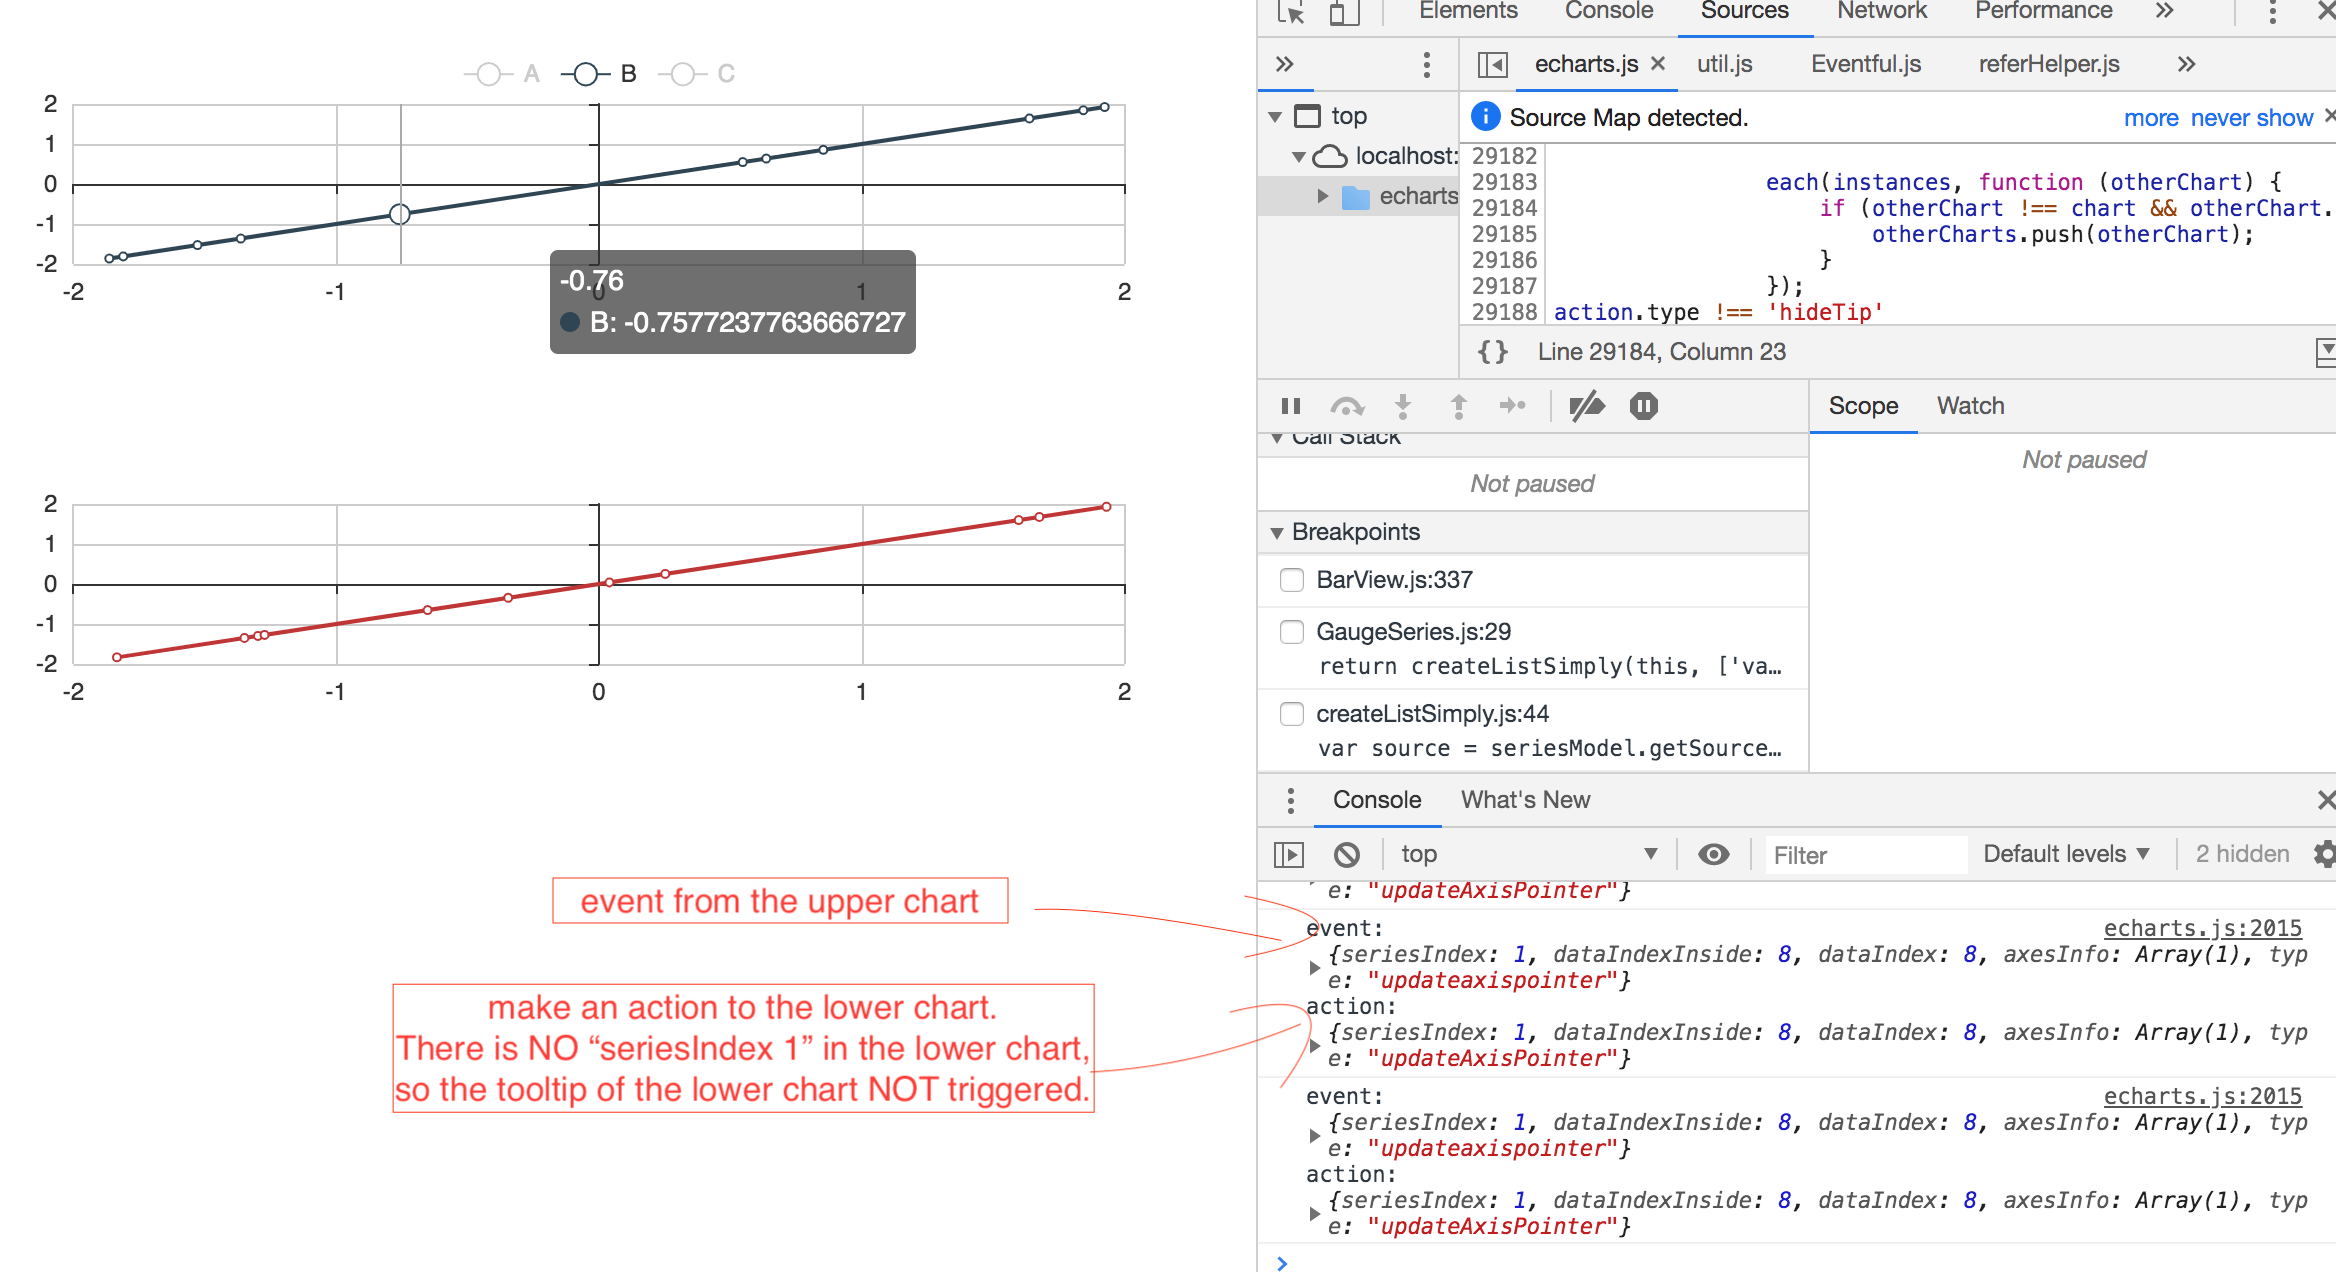
Now the question is:
connect works based on chart.makeActionFromEvent. But connect is a common feature and use a common way to generate an action from a event. That is, current connect do not know how the charts should be connected accurately. It just use a fuzzy way to connect charts.
To solve this problem, probably their are two ways:
(1) If connect do not match the requirement of users accurately, do not use connect, but connect charts manually. That is, listen to one chart and convert the event to action parameters manually (with user customized convert logic) and call dispatchAction to the other charts.
The backwards of the way is that it probably brings lot of burden to users to listen every events the needed (for example, including highlight/downplay, updateAxisPointer, hideTip, ...)
(2) Enhance the current connect feature. Enable it to customize the chart.makeActionFromEvent by users.
(3) Any other ideas?
@Ovilia @yufeng04 @pissang @The-only
 100pah
on 27 Oct 2019
100pah
on 27 Oct 2019
Hi all!
Happy New Year!
Is there an ETA on a fix?
@pissang - you did an amazing job with summarizing it up and proposing solutions! Great job and thank you!
lwedel
on 4 Jan 2020
Hi, my project also encounters this issue, hopefully we can get a more customizable connect() api!
 boyuanfang
on 30 Jul 2020
boyuanfang
on 30 Jul 2020
Related issues
 wm370857724
·
3Comments
wm370857724
·
3Comments
 jarben
·
3Comments
jarben
·
3Comments
jarben
·
3Comments
jarben
·
3Comments
 Thinkpad93
·
3Comments
Thinkpad93
·
3Comments
 kirazxyun
·
3Comments
kirazxyun
·
3Comments
Most helpful comment
Provide some info about this issue:
Now the question is:
connectworks based onchart.makeActionFromEvent. Butconnectis a common feature and use a common way to generate an action from a event. That is, current connect do not know how the charts should be connected accurately. It just use a fuzzy way to connect charts.To solve this problem, probably their are two ways:
(1) If
connectdo not match the requirement of users accurately, do not useconnect, but connect charts manually. That is, listen to one chart and convert theeventtoaction parametersmanually (with user customized convert logic) and calldispatchActionto the other charts.The backwards of the way is that it probably brings lot of burden to users to listen every events the needed (for example, including
highlight/downplay,updateAxisPointer,hideTip, ...)(2) Enhance the current
connectfeature. Enable it to customize thechart.makeActionFromEventby users.(3) Any other ideas?
@Ovilia @yufeng04 @pissang @The-only