Incubator-echarts: How create the timeline with train status on travel?
What problem does this feature solve?
No have any problem but a new feature:
I would create this graph, the only timeline, (with eCharts library) when see the train status by stations. Whether it stopped at that station or still has to arrive.
https://i.imgur.com/bkfZweO.png
What does the proposed API look like?
No have API
 Zacknero
All 10 comments
Hi! We've received your issue and please be patient to get responded. 🎉
The average response time is expected to be within one day for weekdays.
In the meanwhile, please make sure that you have posted enough image to demo your request. You may also check out the API and chart option to get the answer.
Have a nice day! 🍵
![echarts-bot[bot] picture](https://avatars1.githubusercontent.com/in/20872?v=4&s=40) echarts-bot[bot]
on 26 Jun 2019
echarts-bot[bot]
on 26 Jun 2019
 Ovilia
on 28 Jun 2019
Ovilia
on 28 Jun 2019
Please see https://echarts.apache.org/en/option.html#timeline
I see it but how remove the cartesian graph and the pie??
Zacknero
on 28 Jun 2019
option = {
timeline: {
data: [
'a', 'b', 'c', 'd'
],
axisType: 'category',
show: true,
autoPlay: false
}
};
option = { timeline: { data: [ 'a', 'b', 'c', 'd' ], axisType: 'category', show: true, autoPlay: false } };
Thaks you!! But i have last question: how i set the colorStops from 2002 to 2004 or 2002 to 2006 with green color and the rest with gray?? it's hard with percentage :(
My code:
option = {
baseOption: {
timeline: {
axisType: 'category',
top: 'auto',
currentIndex: 2,
controlStyle: {
show: false
},
data: [
'2002-01-01','2003-01-01','2004-01-01',
{
value: '2005-01-01',
symbol: 'diamond',
symbolSize: 16
},
'2006-01-01', '2007-01-01','2008-01-01','2009-01-01','2010-01-01',
{
value: '2011-01-01',
symbol: 'diamond',
symbolSize: 18
},
],
label: {
formatter : function(s) {
return (new Date(s)).getFullYear();
},
position: 'top',
rotate: 90,
padding: -10
},
lineStyle: {
color: {
type: 'linear',
colorStops: [{
offset: 0, color: 'green' // color at 0% position
}, {
offset: 0.1, color: 'grey' // color at 100% position
}]
}
}
}
}
};
option = { timeline: { data: [ 'a', 'b', 'c', 'd' ], axisType: 'category', show: true, autoPlay: false } };Thaks you!! But i have last question: how i set the colorStops from 2002 to 2004 or 2002 to 2006 with green color and the rest with gray?? it's hard with percentage :(
My code:option = { baseOption: { timeline: { axisType: 'category', top: 'auto', currentIndex: 2, controlStyle: { show: false }, data: [ '2002-01-01','2003-01-01','2004-01-01', { value: '2005-01-01', symbol: 'diamond', symbolSize: 16 }, '2006-01-01', '2007-01-01','2008-01-01','2009-01-01','2010-01-01', { value: '2011-01-01', symbol: 'diamond', symbolSize: 18 }, ], label: { formatter : function(s) { return (new Date(s)).getFullYear(); }, position: 'top', rotate: 90, padding: -10 }, lineStyle: { color: { type: 'linear', colorStops: [{ offset: 0, color: 'green' // color at 0% position }, { offset: 0.1, color: 'grey' // color at 100% position }] } } } } };
@Ovilia please, have any solutions for decorate the lines? Thnaks!!
Zacknero
on 1 Jul 2019
Try this
lineStyle: {
color: {
type: 'linear',
colorStops: [{
                        offset: 0, color: 'green' // color at 0% position
                    }, {
                        offset: 0.1, color: 'green' // color at 10% position
                    }, {
                        offset: 0.10000001, color: 'grey' // color at 100% position
                    }]
}
}
colorStops: [{ offset: 0, color: 'green' // color at 0% position }, { offset: 0.1, color: 'green' // color at 10% position }, { offset: 0.10000001, color: 'grey' // color at 100% position }]
This not working :( Isn't possible set color dynamic not by offset?? because the dates is dynamic and i would set color green from 2002 to 2006 or 2008....
Zacknero
on 2 Jul 2019
colorStops: [{ offset: 0, color: 'green' // color at 0% position }, { offset: 0.1, color: 'green' // color at 10% position }, { offset: 0.10000001, color: 'grey' // color at 100% position }]This not working :( Isn't possible set color dynamic not by offset?? because the dates is dynamic and i would set color green from 2002 to 2006 or 2008....
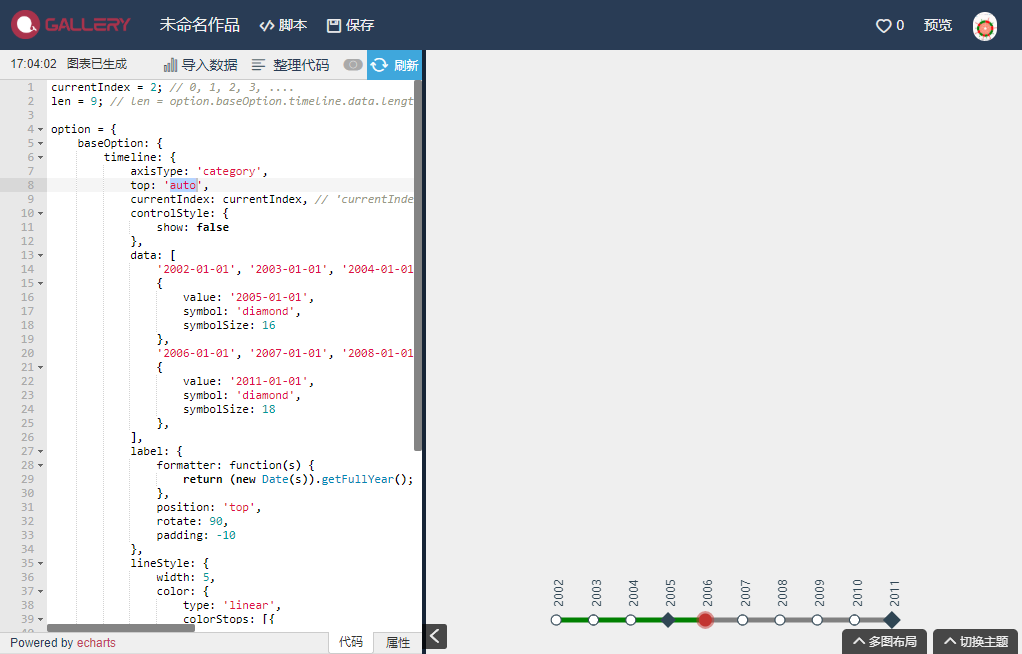
It working well here ...
https://gallery.echartsjs.com/editor.html?c=xwsyY9DhLb&v=2
currentIndex = 2; // 0, 1, 2, 3, ....
len = 9; // len = option.baseOption.timeline.data.length

option = {
    baseOption: {
        timeline: {
            axisType: 'category',
            top: 'auto',
            currentIndex: currentIndex, // 'currentIndex: 2' -> 'currentIndex: currentIndex'
            controlStyle: {
                show: false
            },
            data: [
                '2002-01-01', '2003-01-01', '2004-01-01',
                {
                    value: '2005-01-01',
                    symbol: 'diamond',
                    symbolSize: 16
                },
                '2006-01-01', '2007-01-01', '2008-01-01', '2009-01-01', '2010-01-01',
                {
                    value: '2011-01-01',
                    symbol: 'diamond',
                    symbolSize: 18
                },
            ],
            label: {
                formatter: function(s) {
                    return (new Date(s)).getFullYear();
                },
                position: 'top',
                rotate: 90,
                padding: -10
            },
            lineStyle: {
                width: 5,  //  I am nearsighted ...
                color: {
                    type: 'linear',
                    colorStops: [{
                        offset: currentIndex / len,
                        color: 'green' // color at position < (currentIndex / len)
                    }, {
                        offset: currentIndex / len,
                        color: 'grey' // color at position > (currentIndex / len)
                    }]
                }
            }
        }
    }
};

myChart.on('timelinechanged', function(params) {
    option.baseOption.timeline.currentIndex = params.currentIndex;
    option.baseOption.timeline.lineStyle.color.colorStops[0].offset = params.currentIndex / (option.baseOption.timeline.data.length - 1);
    option.baseOption.timeline.lineStyle.color.colorStops[1].offset = params.currentIndex / (option.baseOption.timeline.data.length - 1);
    myChart.setOption(option);
});
 zhouxin860114
on 4 Jul 2019
zhouxin860114
on 4 Jul 2019
colorStops: [{
                        offset: 0, color: 'green' // color at 0% position
                    }, {
                        offset: 0.1, color: 'green' // color at 10% position
                    }, {
                        offset: 0.10000001, color: 'grey' // color at 100% position
                    }]
This not working :( Isn't possible set color dynamic not by offset?? because the dates is dynamic and i would set color green from 2002 to 2006 or 2008....
It working well here ...
https://gallery.echartsjs.com/editor.html?c=xwsyY9DhLb&v=2currentIndex = 2; // 0, 1, 2, 3, .... len = 9; // len = option.baseOption.timeline.data.length option = { baseOption: { timeline: { axisType: 'category', top: 'auto', currentIndex: currentIndex, // 'currentIndex: 2' -> 'currentIndex: currentIndex' controlStyle: { show: false }, data: [ '2002-01-01', '2003-01-01', '2004-01-01', { value: '2005-01-01', symbol: 'diamond', symbolSize: 16 }, '2006-01-01', '2007-01-01', '2008-01-01', '2009-01-01', '2010-01-01', { value: '2011-01-01', symbol: 'diamond', symbolSize: 18 }, ], label: { formatter: function(s) { return (new Date(s)).getFullYear(); }, position: 'top', rotate: 90, padding: -10 }, lineStyle: { width: 5, // I am nearsighted ... color: { type: 'linear', colorStops: [{ offset: currentIndex / len, color: 'green' // color at position < (currentIndex / len) }, { offset: currentIndex / len, color: 'grey' // color at position > (currentIndex / len) }] } } } } }; myChart.on('timelinechanged', function(params) { option.baseOption.timeline.currentIndex = params.currentIndex; option.baseOption.timeline.lineStyle.color.colorStops[0].offset = params.currentIndex / (option.baseOption.timeline.data.length - 1); option.baseOption.timeline.lineStyle.color.colorStops[1].offset = params.currentIndex / (option.baseOption.timeline.data.length - 1); myChart.setOption(option); });
Thank you and this is a perfect solutions!!
Zacknero
on 4 Jul 2019
Related issues
 hanhui
·
3Comments
hanhui
·
3Comments
 marine1ly
·
3Comments
marine1ly
·
3Comments
 jarben
·
3Comments
jarben
·
3Comments
 decadef20
·
3Comments
decadef20
·
3Comments
 Cyycl
·
3Comments
Cyycl
·
3Comments
Most helpful comment
It working well here ...
https://gallery.echartsjs.com/editor.html?c=xwsyY9DhLb&v=2