Incubator-echarts: DataZoom Slider Does Not Respect Y Axis min if positive value
Version
4.2.1
Steps to reproduce
Create a 2 axis Cartesian chart
make x axis category, and y axis a value axis.
set y axis minimum to a positive value
set datazoom on y axis as a slider
Notice chart y axis does not adhere to y-axis minimum, instead is 0
What is expected?
If y axis has a min and/or max set, the data zoom should adhere and have the same range as the chart's y axis
What is actually happening?
chart's y axis listens to y axis min, but data zoom bottom(start) on y axis is always equal to 0 if yAxis.min is a positive number. If min is set to a negative number, datazoom will respect it.
this can be replicated on the demo linked below.
notice datazoom y axis bottom is equal to -30.
change y axis min to 10.
notice datazoom y axis bottom is equal to 0
https://ecomfe.github.io/echarts-examples/public/editor.html?c=line-draggable
 Dus1988
All 5 comments
Hi! We've received your issue and please be patient to get responded. 🎉
The average response time is expected to be within one day for weekdays.
In the meanwhile, please make sure that you have posted enough image to demo your request. You may also check out the API and chart option to get the answer.
Have a nice day! 🍵
![echarts-bot[bot] picture](https://avatars1.githubusercontent.com/in/20872?v=4&s=40) echarts-bot[bot]
on 3 May 2019
echarts-bot[bot]
on 3 May 2019
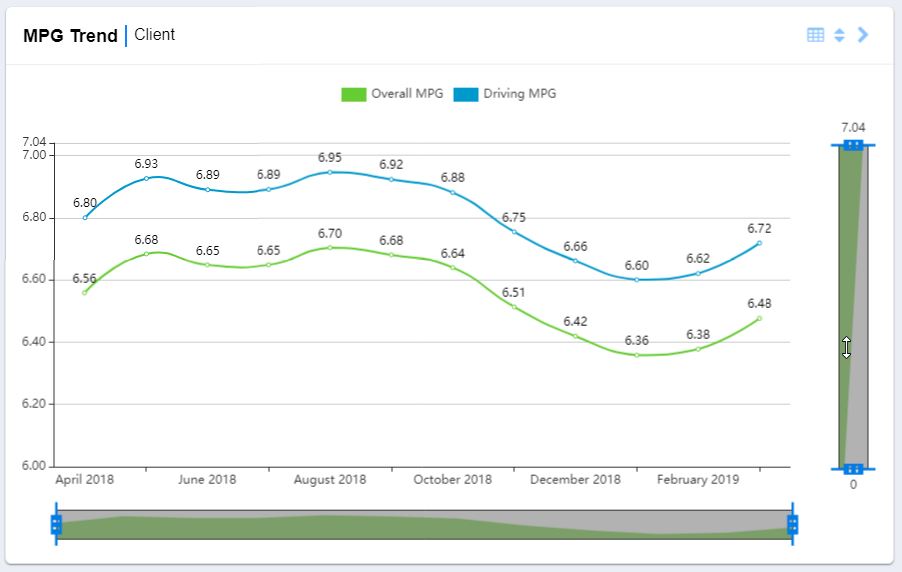
Here is a screenshot of the issue
Dus1988
on 3 May 2019
Update: this also happens with the X axis.
Dus1988
on 8 May 2019
@Dus1988 axis scale is set to 'false' as default, and if min or max was set, scale shouldn't work, but it didn't check
https://github.com/apache/incubator-echarts/blob/master/src/component/dataZoom/AxisProxy.js#L476
 susiwen8
on 12 May 2019
susiwen8
on 12 May 2019
@Dus1988 at this moment, you can add scale to true in option to fix this problem
yAxis: {
                min: 10,
                max: 60,
                scale: true,
                type: 'value',
                scale: true,
                axisLine: {
                    onZero: false
                }
            },
susiwen8
on 12 May 2019
Related issues
 jarben
·
3Comments
jarben
·
3Comments
 jxffly
·
3Comments
jxffly
·
3Comments
 shikelong
·
3Comments
shikelong
·
3Comments
 RoxetteI
·
3Comments
RoxetteI
·
3Comments
 Thinkpad93
·
3Comments
Thinkpad93
·
3Comments