Incubator-echarts: How to remove the round and the arrow on a markLine ?
One-line summary [问题简述]
Is it possible to remove the two symbols (the round and the arrow) on a markLine ?
Version & Environment [版本及环境]
- ECharts version [ECharts 版本]: 4.0.4
- Browser version [浏览器类型和版本]: -
- OS Version [操作系统类型和版本]: -
Expected behaviour [期望结果]
I want to get a simple markline without any symbol on my chart. The problem is when I use the symbol: 'none' property, it only removes the round symbol and I still have the arrow.
{
        yAxis: MY_VALUE,
        symbol: 'none'
}
I found a way to remove both:
[
         {
                yAxis: MY_VALUE,
                xAxis: startDate,
                symbol: 'none'
        },
        {
                yAxis: MY_VALUE,
                xAxis: endDate,
                symbol: 'none'
        }
]
But with this solution, when i use the zoom on the chart, my marklines disappears..
So, is there any way to get a simple markline without any the Symbols ?
ECharts option [ECharts配置项]
option = {
  "tooltip": {
    "trigger": "axis"
  },
  "grid": {
    "top": 40,
    "right": "10%",
    "bottom": 80,
    "left": "10%",
    "height": 270
  },
  "xAxis": [
    {
      "nameLocation": "middle",
      "data": [],
      "nameGap": 30,
      "splitLine": {
        "show": false
      },
      "type": "time",
      "position": "bottom",
      "axisLabel": {}
    }
  ],
  "yAxis": [
    {
      "nameLocation": "middle",
      "data": [],
      "nameGap": 30,
      "splitLine": {
        "show": false
      },
      "type": "value",
      "name": "Profondeur (m)",
      "axisLabel": {},
      "min": -40
    }
  ],
  "series": [
    {
      "name": "Mesure",
      "type": "line",
      "connectNulls": false,
      "data": [
        {
          "value": [
            "2017/08/31",
            null
          ],
          "date": 1504186980093
        },
        {
          "value": [
            "2017/09/01",
            -16.84
          ],
          "date": 1504216800000
        },
        {
          "value": [
            "2017/09/02",
            -16.6
          ],
          "date": 1504303200000
        },
        {
          "value": [
            "2017/09/03",
            -16.18
          ],
          "date": 1504389600000
        },
        {
          "value": [
            "2017/09/04",
            -16.26
          ],
          "date": 1504476000000
        },
        {
          "value": [
            "2017/09/05",
            -15.35
          ],
          "date": 1504562400000
        },
        {
          "value": [
            "2017/09/06",
            -14.99
          ],
          "date": 1504648800000
        },
        {
          "value": [
            "2017/09/07",
            -14.92
          ],
          "date": 1504735200000
        },
        {
          "value": [
            "2017/09/08",
            -16.08
          ],
          "date": 1504821600000
        },
        {
          "value": [
            "2017/09/09",
            -16.24
          ],
          "date": 1504908000000
        },
        {
          "value": [
            "2017/09/10",
            -15.44
          ],
          "date": 1504994400000
        },
        {
          "value": [
            "2017/09/11",
            -15.75
          ],
          "date": 1505080800000
        }
      ],
      "lineStyle": {
        "normal": {
          "color": "#3d72d2"
        }
      },
      "itemStyle": {
        "normal": {
          "color": "#3d72d2"
        }
      },
      "markLine": {
        "data": [
          [
            {
              "yAxis": -20.41,
              "xAxis": "2017/08/31",
              "symbol": "none"
            },
            {
              "yAxis": -20.41,
              "xAxis": "2017/09/11",
              "symbol": "none",
              "lineStyle": {
                "normal": {
                  "color": "red",
                  "type": "solid"
                }
              }
            }
          ],
          [
            {
              "yAxis": -26.6,
              "xAxis": "2017/08/31",
              "symbol": "none"
            },
            {
              "yAxis": -26.6,
              "xAxis": "2017/09/11",
              "symbol": "none",
              "lineStyle": {
                "normal": {
                  "color": "grey",
                  "type": "solid"
                }
              }
            }
          ]
        ]
      },
      "markPoint": {
        "symbolSize": 30,
        "data": [
          {
            "xAxis": "2017/09/09",
            "yAxis": -15.82,
            "itemStyle": {
              "color": "blue"
            }
          }
        ]
      },
      "showSymbol": false
    }
  ],
  "title": {
    "text": "Année en cours",
    "left": "center"
  },
  "dataZoom": [
    {
      "type": "inside",
      "start": 0,
      "end": 100
    },
    {
      "start": 0,
      "end": 100,
      "handleSize": "80%",
      "bottom": "0"
    }
  ]
}
Other comments [其他信息]
 julien-origami
All 4 comments
What is the round? Can you provide an image to show?
 Ovilia
on 3 Sep 2018
Ovilia
on 3 Sep 2018
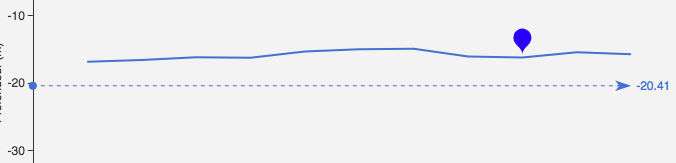
This is the round (Point)

and this is the arrow

So I want to find a way to remove both because here is the default behavior without the "symbol": "none" property
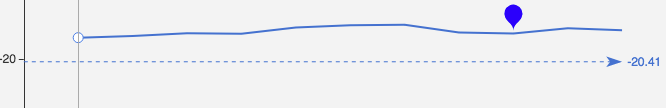
Here is what I i have when i use the "symbol": "none" property
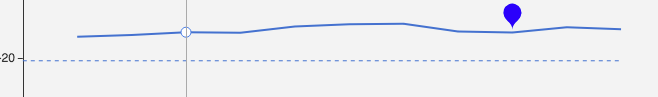
And this is the expected behavior that i want
julien-origami
on 3 Sep 2018
symbol:['none', 'none'],
 armsthinker
on 18 Sep 2018
armsthinker
on 18 Sep 2018
Cannot reproduce the arrow now. Will close if no other information provided.
Ovilia
on 21 Sep 2018
Related issues
 hanhui
·
3Comments
hanhui
·
3Comments
 wm370857724
·
3Comments
wm370857724
·
3Comments
 RoxetteI
·
3Comments
RoxetteI
·
3Comments
 shikelong
·
3Comments
shikelong
·
3Comments
 liuqz
·
3Comments
liuqz
·
3Comments
Most helpful comment
symbol:['none', 'none'],