Incubator-echarts: feature magicType 设置 line和stack,切换时,图形只能展示stack
One-line summary [问题简述]
feature magicType 设置 line和stack,切换时,图形只能展示stack
切换到stack后再次切换为line时,不生效
Version & Environment [版本及环境]
- ECharts version [ECharts 版本]: 3.8.5
- Browser version [浏览器类型和版本]: macBook pro
- OS Version [操作系统类型和版本]: chrome 65.0.3325.181
Expected behaviour [期望结果]
正常切换line 和 stack堆积图
ECharts option [ECharts配置项]
option = {
title: {
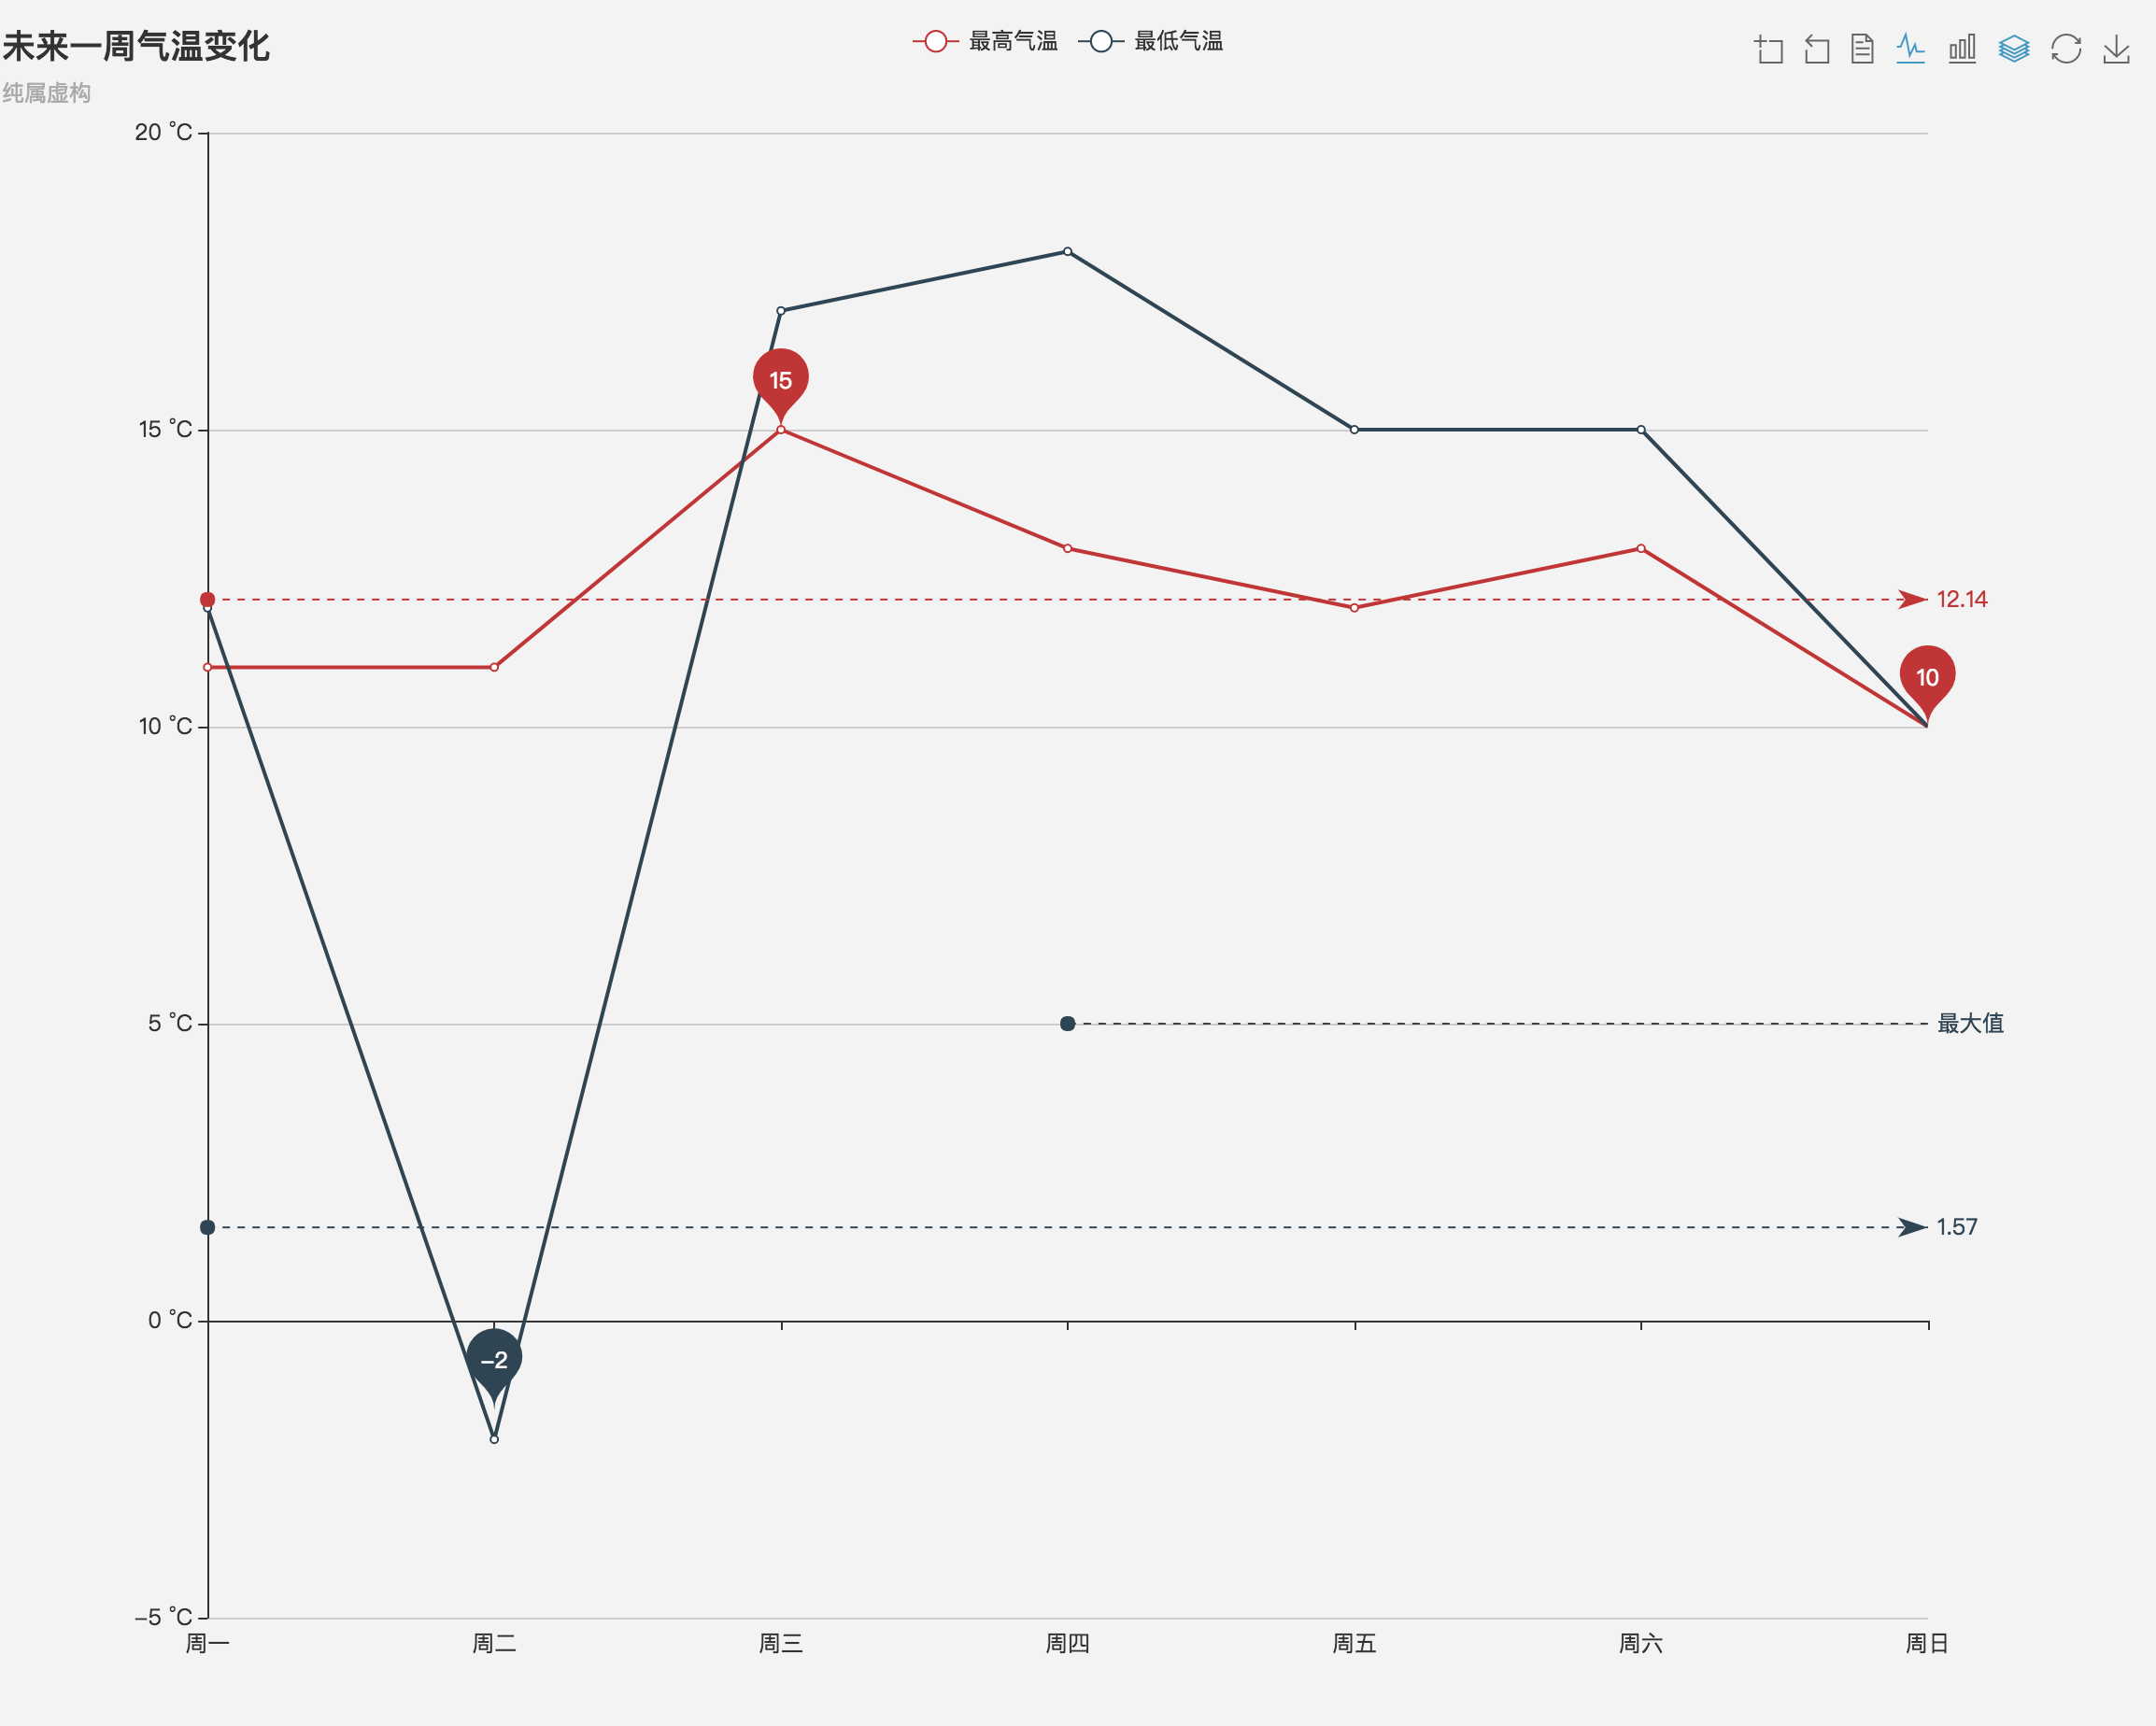
text: '未来一周气温变化',
subtext: '纯属虚构'
},
tooltip: {
trigger: 'axis'
},
legend: {
data:['最高气温','最低气温']
},
toolbox: {
show: true,
feature: {
dataZoom: {
yAxisIndex: 'none'
},
dataView: {readOnly: false},
magicType: {type: ['line', 'bar', 'stack']},
restore: {},
saveAsImage: {}
}
},
xAxis: {
type: 'category',
boundaryGap: false,
data: ['周一','周二','周三','周四','周五','周六','周日']
},
yAxis: {
type: 'value',
axisLabel: {
formatter: '{value} °C'
}
},
series: [
{
name:'最高气温',
type:'line',
data:[11, 11, 15, 13, 12, 13, 10],
markPoint: {
data: [
{type: 'max', name: '最大值'},
{type: 'min', name: '最小值'}
]
},
markLine: {
data: [
{type: 'average', name: '平均值'}
]
}
},
{
name:'最低气温',
type:'line',
data:[1, -2, 2, 5, 3, 2, 0],
markPoint: {
data: [
{name: '周最低', value: -2, xAxis: 1, yAxis: -1.5}
]
},
markLine: {
data: [
{type: 'average', name: '平均值'},
[{
symbol: 'none',
x: '90%',
yAxis: 'max'
}, {
symbol: 'circle',
label: {
normal: {
position: 'start',
formatter: '最大值'
}
},
type: 'max',
name: '最高点'
}]
]
}
}
]
};
Other comments [其他信息]
点击堆叠图后再次点击折线图,不能恢复为正常的折线图,并且两个图标都会高亮,这个应该怎么解决?
stale
 PandaJJ5286
All 4 comments
目前最新版本中这个问题已经正常了。
 100pah
on 28 Apr 2018
100pah
on 28 Apr 2018
👎1
@100pah 您好,我刚刚更新到了最新版本4.1.0,但是问题依然存在,可以请您再帮忙确认一下吗?而且,我在官网demo中实验也是存在这个问题的。
PandaJJ5286
on 2 May 2018
🚀1
@100pah 您说的新版具体是哪个版本?我的版本是4.1.0,还是存在这个问题
 liuqing2018
on 21 Jun 2018
liuqing2018
on 21 Jun 2018
This issue has been automatically marked as stale because it has not had recent activity. It will be closed if no further activity occurs. Thank you for your contributions.
![stale[bot] picture](https://avatars3.githubusercontent.com/in/1724?v=4&s=40) stale[bot]
on 20 Jun 2020
stale[bot]
on 20 Jun 2020
❤1
Was this page helpful?
0 / 5 - 0 ratings
Related issues
 jxffly
·
3Comments
jxffly
·
3Comments
 liuqz
·
3Comments
liuqz
·
3Comments
 marine1ly
·
3Comments
marine1ly
·
3Comments
 RoxetteI
·
3Comments
RoxetteI
·
3Comments
 kirazxyun
·
3Comments
kirazxyun
·
3Comments