Incubator-echarts: 地图可以做到数据聚合效果吗
One-line summary [问题简述]
想要做一个效果,正常情况下就显示省一级的数据,缩放最后会显示具体每个市级的数据,知道mapv有一个数据聚合的效果,请问echarts可以做吗,没查到有关的资料啊,有前辈知道吗,谢谢
Version & Environment [版本及环境]
- ECharts version [ECharts 版本]: 3.6.1
- Browser version [浏览器类型和版本]: chrome
- OS Version [操作系统类型和版本]: win10
Expected behaviour [期望结果]
地图数据聚合效果
ECharts option [ECharts配置项]
option = {

}
Other comments [其他信息]
mapv上的例子:正常视图下显示聚合数据:
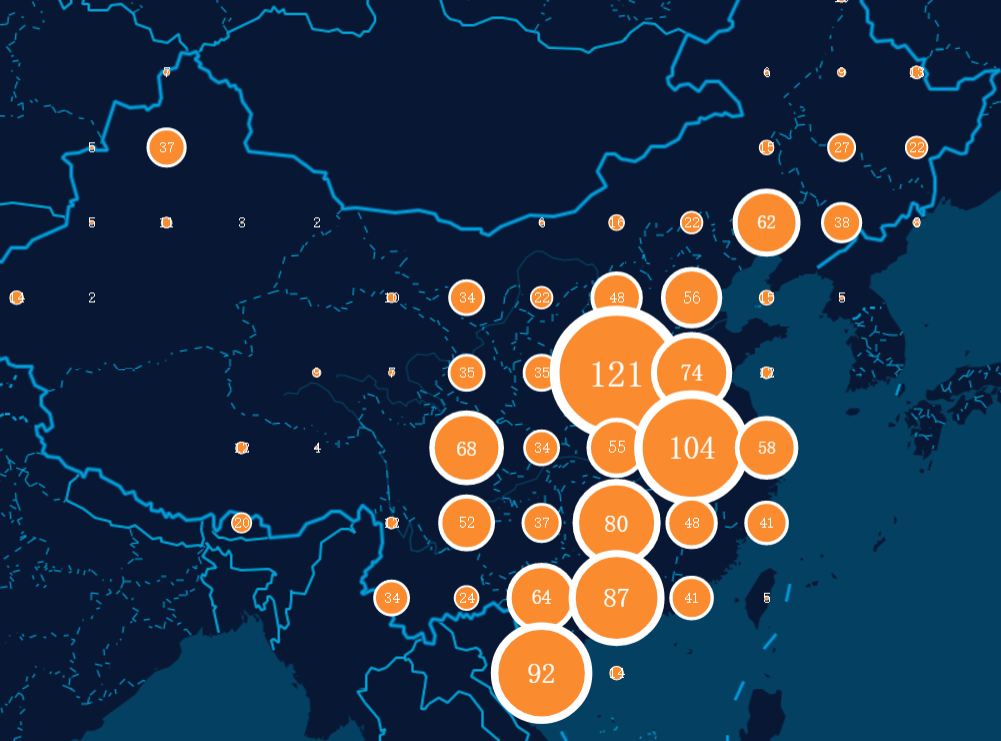
放大之后,显示具体的数据:

stale
 HeNanBing
All 5 comments
echarts 没有内置『数据聚合』。
但是可以在 echarts 外部计算聚合,在 echarts 中渲染结果。
 100pah
on 11 Jul 2017
100pah
on 11 Jul 2017
那要怎么做到很自然的切换呢,是不是就是缩放到一定比例换数据源嘛?
HeNanBing
on 11 Jul 2017
恩是的,比如监听 geoRoam 事件,缩放到一定比例换数据源。
100pah
on 12 Jul 2017
👍2
🎉1
@100pah 非常感谢 我找了好久 终于找到这个事件了 给你100个赞
 18144802250
on 10 Jan 2018
18144802250
on 10 Jan 2018
This issue has been automatically marked as stale because it has not had recent activity. It will be closed if no further activity occurs. Thank you for your contributions.
![stale[bot] picture](https://avatars3.githubusercontent.com/in/1724?v=4&s=40) stale[bot]
on 3 Apr 2020
stale[bot]
on 3 Apr 2020
Was this page helpful?
0 / 5 - 0 ratings
Related issues
 shikelong
·
3Comments
shikelong
·
3Comments
 antorman
·
3Comments
antorman
·
3Comments
 Zendic
·
3Comments
Zendic
·
3Comments
 decadef20
·
3Comments
decadef20
·
3Comments
 hanhui
·
3Comments
hanhui
·
3Comments
Most helpful comment
恩是的,比如监听
geoRoam事件,缩放到一定比例换数据源。