Incubator-echarts: Time axis - bar chart start position moving out of x-axis
One-line summary [问题简述]
When using Time Axis for bar chart, If the value available for the start position then it moves left to the x-start axis to keep bar position centered(same for end position or stacked bar). pl check the screenshots attached.


 vij1ay
All 13 comments
I hope that boundaryGap can help you ~
 100pah
on 7 Jan 2017
100pah
on 7 Jan 2017
This issue persits when axis is continous value or time, boundary gap is sufficient for end points, but this problems occurs again when we zoom inside
Example code from documentation has similar issue:
option = {
    dataZoom: [
        {
            id: 'dataZoomX',
            type: 'slider',
            xAxisIndex: [0],
            filterMode: 'empty'
        },
        {
            id: 'dataZoomY',
            type: 'slider',
            yAxisIndex: [0],
            filterMode: 'empty'
        }
    ],
    xAxis: {type: 'value'},
    yAxis: {type: 'value'},
    series:{
        type: 'bar',
        data: [
            // The first column corresponds to xAxis,
            // and the second coloum corresponds to yAxis.
            [12, 24, 36],
            [90, 80, 70],
            [3, 9, 27],
            [1, 11, 111]
        ]
    }
}
 akansal1
on 14 Jan 2017
akansal1
on 14 Jan 2017
Are there any solutions to this problem?
 haiyanghe
on 25 Jan 2017
haiyanghe
on 25 Jan 2017
Hi @100pah
Any update on the issue discussed above ?
akansal1
on 13 Feb 2017
@100pah @haiyanghe @c-okelly I have a similar issues when using bar graph and time values for the xAxis. Using boundary gap does fix the issues when the chart is loaded but once you zoom in the issues appears again as mentioned by akansal1.
Also using boundary gap wouldn't really take into account how different data might be displayed and would have to be adjusted for different data sets.
I am happy to work on the issue on the eCharts repo if I could get a bit of direction on it?
 c-okelly
on 5 Sep 2017
c-okelly
on 5 Sep 2017
@100pah @haiyanghe @vij1ay I have implemented a proposed fix in a fork I have created at https://github.com/c-okelly/echarts. My idea is to make the chart start slightly earlier and finished slightly later when the presence of bars on a time graph is detected.
The following code is added to axisHelper.js
numberBarPlots = model.getModel().ecModel.getSeriesByType("bar").length;
        if (scaleType == 'time' && numberBarPlots > 0){
            var buffer = (max - min) * (0.01 * numberBarPlots);
            max += buffer;
            min -= buffer;
        }
While this seems to fix the use case of as described above the issues reappears when the chart is zoomed in as show in the pictures below. No 1. No 2.
I have spend a good bit of time going over your code and trying to get to grips with the overall architecture you are using.
I would propose make the bug fix more intelligent first calculating to see if an overflow exists and then adjusting the start and end point of the xAxis to account for this (should ensure that the bars are within the Axis).
I am currently trying to understand how to calculate the box that would exist around each point on the graph. Red box in No 3.
I would very much appreciate any feedback you could provide or guidance on how I could adjust my fix to better fit in with your own overall plan. Or if you have a better idea to approach this problem.
Thanks,
Conor
No 0. - Before fix
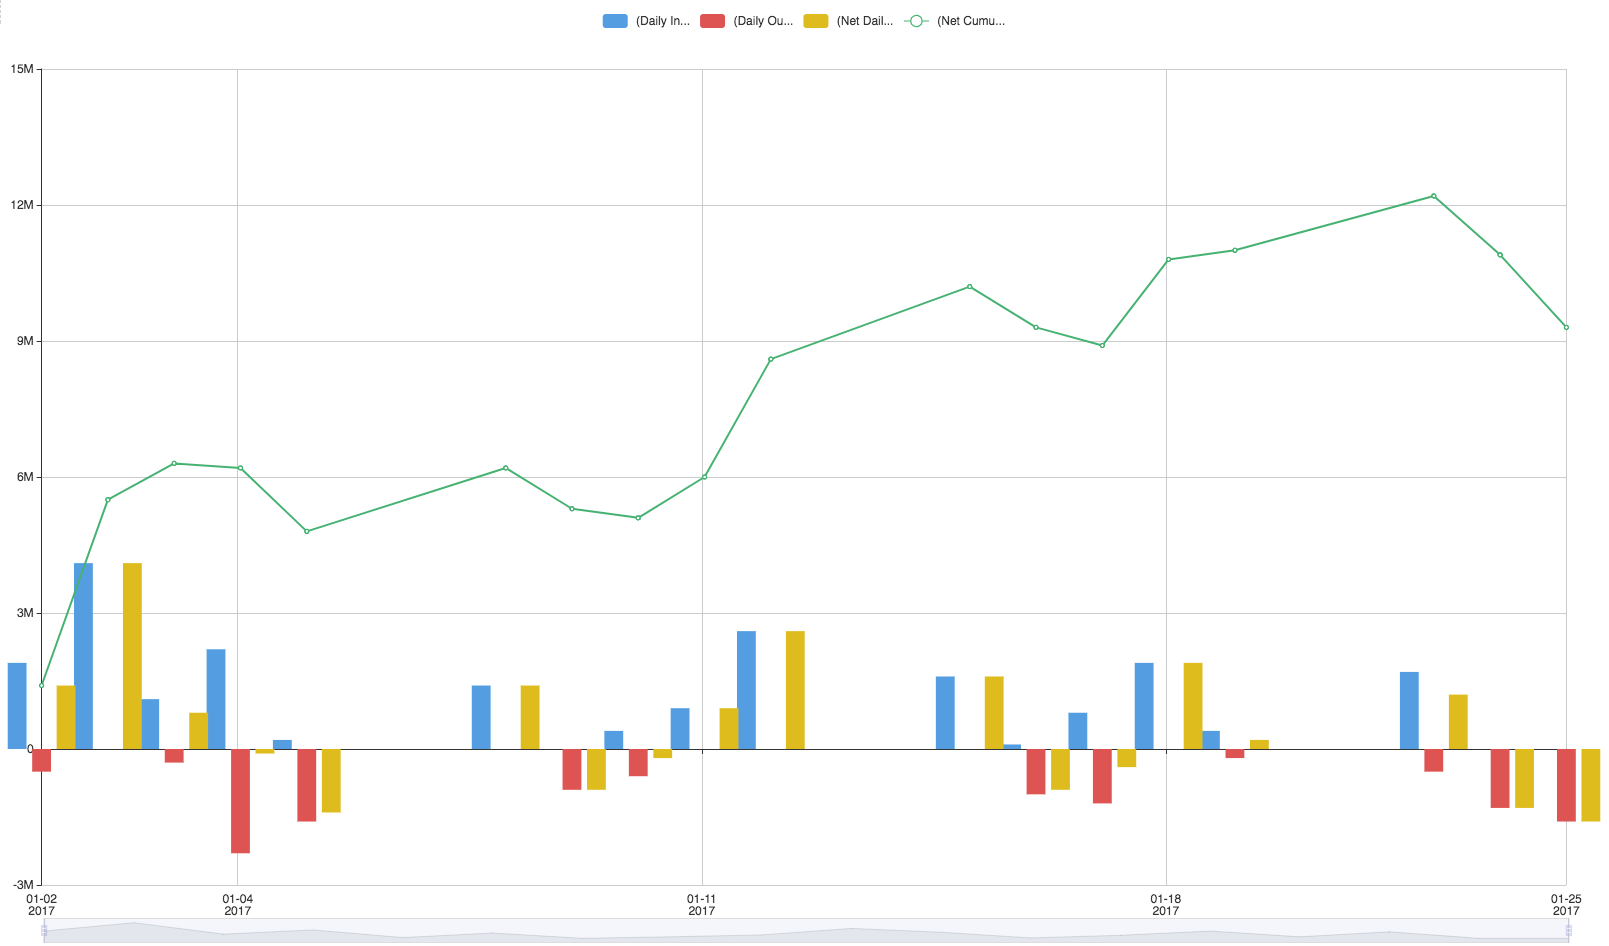
No 1. - Proposed current fix
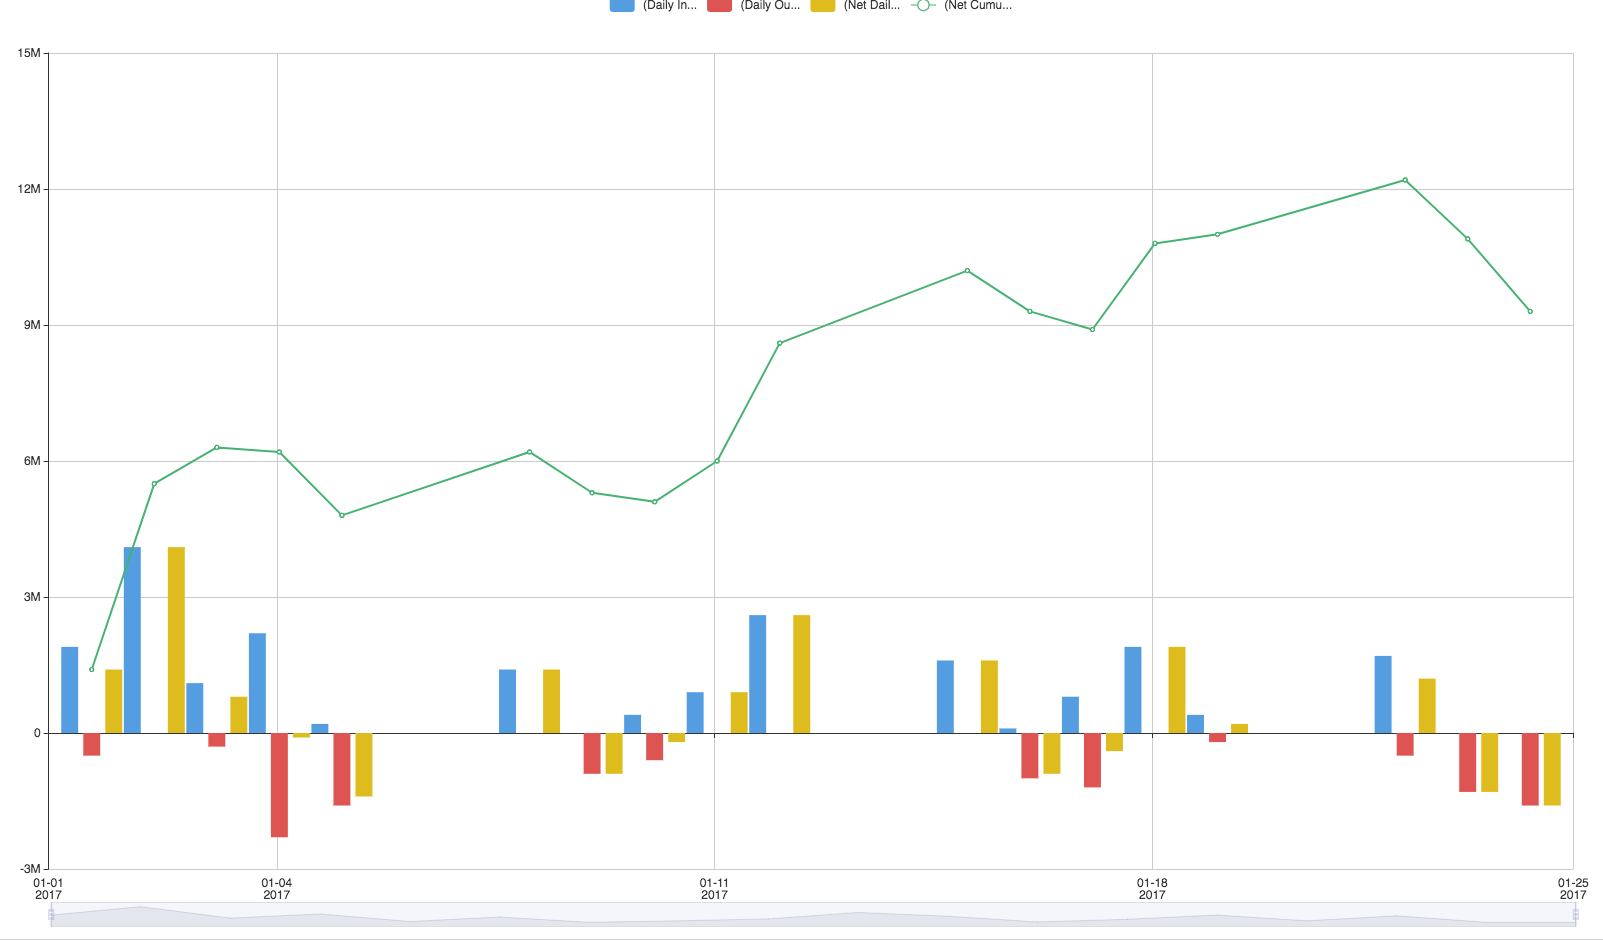
No 2. - Issue reappear when zooming
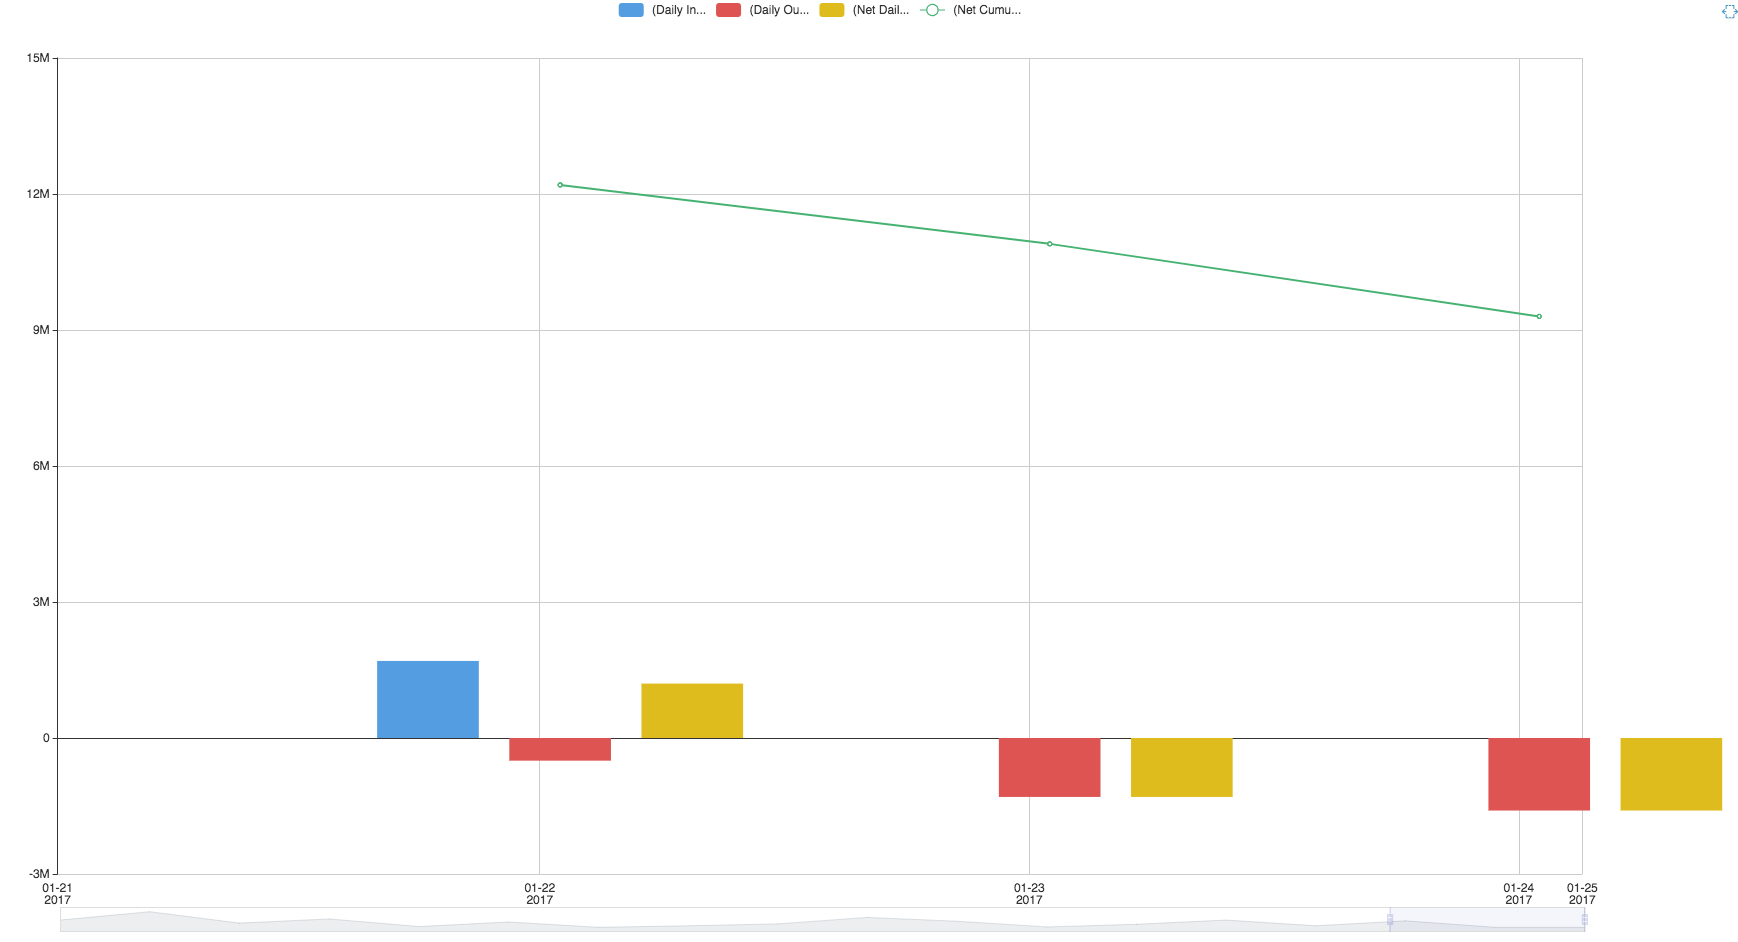
No 3. - Area I am trying to calculate to adjust for

c-okelly
on 13 Sep 2017
I have opened a pull request that fixes this issues and works for zooming as well. #6728
c-okelly
on 20 Sep 2017
@100pah Can we please close the issue.
Thanks,
C
c-okelly
on 30 Nov 2017
is this issue fixed?I am still seeing it in 3.3.4
 liujiong1982
on 25 Jun 2018
liujiong1982
on 25 Jun 2018
@liujiong1982 This bug has been fixed in echarts version 4.0.3
c-okelly
on 25 Jun 2018
Version 4.2.1 the issue persists
 woakas
on 12 Jul 2019
woakas
on 12 Jul 2019
Issue does not persists it was fixed. This is a regression due to lack of testing for the use case.
Looking at the original fix and reworking it would be a reasonable starting point for someone looking to fix it
c-okelly
on 12 Jul 2019
This issue is neither stale or closed.
This is a regression on a previous fix.
Could we please re-open this and I will try do the fix when I have some free time
c-okelly
on 7 Aug 2019
Related issues
 publisherfk
·
3Comments
publisherfk
·
3Comments
 liuqz
·
3Comments
liuqz
·
3Comments
 akvaliya
·
3Comments
akvaliya
·
3Comments
 RoxetteI
·
3Comments
RoxetteI
·
3Comments
 marine1ly
·
3Comments
marine1ly
·
3Comments
Most helpful comment
Are there any solutions to this problem?