Icinga2: Add more status metrics to /v1/status/ApiListener
While it's greate zo have status/zones sometimes we need a bit more details about how connections are doing.
Especially the connection between two endpoints within the same zone can not be debugged with the existing API information.
As a quick brainstorm I was thinking about the following status data I wanted to see per endpoint. I don't know if are available and if there should be any more but it's a start.
- connected: yes/no
- log-lag: seconds
- connection bandwidth: b/s
- all that are available in
json_rpcendpoint but not summed up but per endpoint - maybe remaining time of validity of the certificate
- disconnects / timeouts within the last hour(?)
- time difference (if I was allowed to make a wish)
 widhalmt
All 8 comments
ref/NC/619019
widhalmt
on 15 Jul 2019
We don't have /v1/status/zones atm, not sure what you are referring to. Imho we shouldn't introduce yet another URL endpoint but add the missing details into the already available endpoints, like /v1/status/ApiListener.
 dnsmichi
on 15 Jul 2019
dnsmichi
on 15 Jul 2019
Sorry, I was very confusing in what I was writing. I meant the status/zones part of the status output.
widhalmt
on 15 Jul 2019
Both would be find for me. An addition to the already long status output or sub-endpoints like status/ApiListener.
widhalmt
on 15 Jul 2019
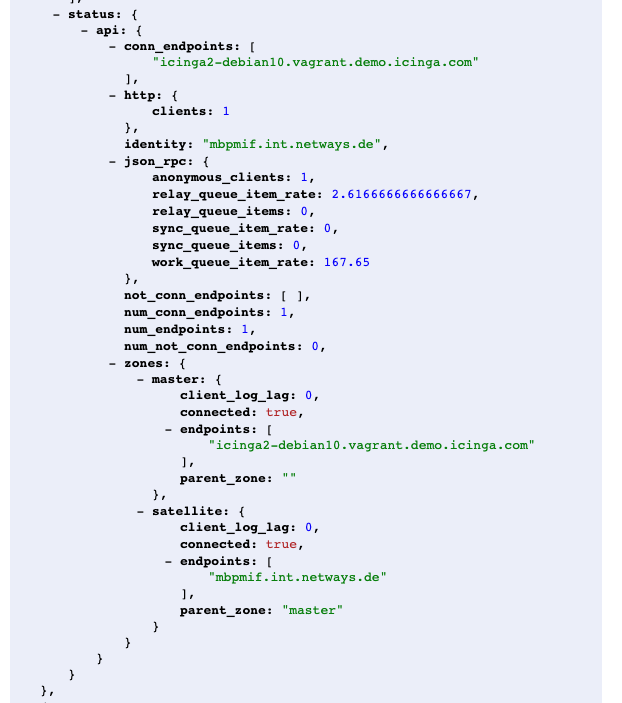
Already available
- zones with
connected(only valid for directly connected zones) client_log_lagis in seconds
Opt-in available in memory
- Certificate details (validity, issuer, etc.)
- Endpoints with bytes_received_per_second, bytes_sent_per_second (visible via /v1/objects/endpoints)
Things we don't actively measure
- Network bandwidth (locally for the interface)
- Connects/Disconnect rates, TCP Timeouts
- Time difference (needs additional sync attributes)
Clarification needed
all that are available in json_rpc endpoint but not summed up but per endpoint
The queue items in there cannot be split, that's stats from the network stack's queues, not endpoints.
dnsmichi
on 16 Jul 2019
Ok, certificate details and bytes_received_per_second, bytes_sent_per_second looks like it's way better than nothing.
Would it be possible to add monitors to get more information on a per endpoint basis like the one from the json_rpc? I understand that the way Icinga's now collecting the data that's a no-go, but could this be part of an improvement?
widhalmt
on 30 Jul 2019
Adding such metrics could slow down the network stack in regions where performance weighs over numbers in a health graph. I don't think it is worth the effort to try to break things down even more.
How about the other mentioned parts, which one of them are truly necessary to resolve this issue?
dnsmichi
on 31 Jul 2019
@widhalmt please respond to the question to proceed further.
dnsmichi
on 15 Jan 2020
Related issues
 Duffkess
·
6Comments
Duffkess
·
6Comments
 shellscriptcode
·
6Comments
shellscriptcode
·
6Comments
 mickenordin
·
5Comments
mickenordin
·
5Comments
 Al2Klimov
·
6Comments
Al2Klimov
·
6Comments
 silenceJI
·
5Comments
silenceJI
·
5Comments