Icinga2: ElasticsearchWriter not writing to ES
On icinga2 startup ElasticsearchWriter (ESW) does write out 1 or 2 check status, but after that they just continue to accumulate, never writing out to ES.
Expected Behavior
ESW should continue to write out and not just acculumate in the queue.
Current Behavior
1 or 2 checks are written to ES, the rest never do:
[2018-06-06 17:21:58 +0000] information/ElasticsearchWriter: 'elasticsearch' started.
[2018-06-06 17:21:58 +0000] information/DbConnection: 'ido-pgsql' started.
[2018-06-06 17:21:58 +0000] information/NotificationComponent: 'notification' started.
[2018-06-06 17:21:58 +0000] information/ConfigItem: Activated all objects.
[2018-06-06 17:21:58 +0000] information/DbConnection: Resuming IDO connection: ido-pgsql
[2018-06-06 17:21:58 +0000] information/IdoPgsqlConnection: 'ido-pgsql' resumed.
[2018-06-06 17:21:58 +0000] information/ConfigItem: Instantiated 1 Downtime.
[2018-06-06 17:21:58 +0000] information/ConfigItem: Triggering Start signal for config items
[2018-06-06 17:21:58 +0000] information/ConfigItem: Activated all objects.
[2018-06-06 17:21:58 +0000] information/IdoPgsqlConnection: PGSQL IDO instance id: 1 (schema version: '1.14.3')
[2018-06-06 17:21:58 +0000] information/IdoPgsqlConnection: Finished reconnecting to PostgreSQL IDO database in 0.416352 second(s).
[2018-06-06 17:22:08 +0000] information/WorkQueue: #6 (ApiListener, SyncQueue) items: 0, rate:  0/s (0/min 0/5min 0/15min);
[2018-06-06 17:22:08 +0000] information/WorkQueue: #5 (ApiListener, RelayQueue) items: 0, rate: 0.383333/s (23/min 23/5min 23/15min);
[2018-06-06 17:22:08 +0000] information/WorkQueue: #7 (ElasticsearchWriter, elasticsearch) items: 0, rate:  0/s (0/min 0/5min 0/15min);
[2018-06-06 17:22:08 +0000] information/WorkQueue: #8 (IdoPgsqlConnection, ido-pgsql) items: 0, rate: 0.233333/s (14/min 14/5min 14/15min);
[2018-06-06 17:22:28 +0000] information/WorkQueue: #7 (ElasticsearchWriter, elasticsearch) items: 3, rate: 0.0333333/s (2/min 2/5min 2/15min); empty in 9 seconds
[2018-06-06 17:22:38 +0000] information/WorkQueue: #7 (ElasticsearchWriter, elasticsearch) items: 6, rate: 0.0333333/s (2/min 2/5min 2/15min); empty in 19 seconds
[2018-06-06 17:22:48 +0000] information/WorkQueue: #7 (ElasticsearchWriter, elasticsearch) items: 9, rate: 0.0333333/s (2/min 2/5min 2/15min); empty in 29 seconds
[2018-06-06 17:22:58 +0000] information/WorkQueue: #7 (ElasticsearchWriter, elasticsearch) items: 11, rate: 0.0333333/s (2/min 2/5min 2/15min); empty in 55 seconds
[2018-06-06 17:23:08 +0000] information/WorkQueue: #7 (ElasticsearchWriter, elasticsearch) items: 11, rate: 0.0333333/s (2/min 2/5min 2/15min); empty in -2147483648 days
[2018-06-06 17:23:18 +0000] information/WorkQueue: #7 (ElasticsearchWriter, elasticsearch) items: 13, rate:  0/s (0/min 2/5min 2/15min); empty in 1 minute and 4 seconds
etc.. ever increasing the items stored in the WorkQueue but never emptying.
Steps to Reproduce (for bugs)
- Install & setup ElasticSearch
- Install & setup Icinga2
- Enable the elasticsearch icinga2 feature
- Startup icinga2
- Open up kibana or other ES query tool and monitor the icinga2* indexes, confirm that 1 or 2 events end up there, but no more.
Context
Initially I was running this icinga2 instance against ElasticSearch 6.2.9 but hit the 400 bug, so I rolled back to the 5.x branch, initially 5.6.9 but then I hit this bug, so I rolled back to 5.6.4 as I saw it specifically mentioned as being tested and working in 14953dff428c04bcc1a9a24fc3f7bdbdfe43eb2e
Your Environment
- Version used (
icinga2 --version):v2.8.4-736-geb3956f
I've also tried 2.8.3, to no avail, tried the snapshot to see if there was an unreleased fix. - Operating System and version:
CentOS Linux release 7.5.1804 (Core) - Enabled features (
icinga2 feature list):Enabled features: api checker elasticsearch ido-pgsql mainlog notification - Icinga Web 2 version and modules (System - About):
2.5.3 - Config validation (
icinga2 daemon -C):
[2018-06-06 17:35:01 +0000] information/cli: Icinga application loader (version: v2.8.4-736-geb3956f)
[2018-06-06 17:35:01 +0000] information/cli: Loading configuration file(s).
[2018-06-06 17:35:01 +0000] information/ConfigItem: Committing config item(s).
[2018-06-06 17:35:01 +0000] information/ApiListener: My API identity: dev-kibana.jpl.nasa.gov
[2018-06-06 17:35:01 +0000] information/ConfigItem: Instantiated 11 Services.
[2018-06-06 17:35:01 +0000] information/ConfigItem: Instantiated 3 ServiceGroups.
[2018-06-06 17:35:01 +0000] information/ConfigItem: Instantiated 1 ScheduledDowntime.
[2018-06-06 17:35:01 +0000] information/ConfigItem: Instantiated 1 Host.
[2018-06-06 17:35:01 +0000] information/ConfigItem: Instantiated 1 FileLogger.
[2018-06-06 17:35:01 +0000] information/ConfigItem: Instantiated 1 NotificationComponent.
[2018-06-06 17:35:01 +0000] information/ConfigItem: Instantiated 2 NotificationCommands.
[2018-06-06 17:35:01 +0000] information/ConfigItem: Instantiated 12 Notifications.
[2018-06-06 17:35:01 +0000] information/ConfigItem: Instantiated 1 IcingaApplication.
[2018-06-06 17:35:01 +0000] information/ConfigItem: Instantiated 2 HostGroups.
[2018-06-06 17:35:01 +0000] information/ConfigItem: Instantiated 1 ApiListener.
[2018-06-06 17:35:01 +0000] information/ConfigItem: Instantiated 10 Downtimes.
[2018-06-06 17:35:01 +0000] information/ConfigItem: Instantiated 1 ElasticsearchWriter.
[2018-06-06 17:35:01 +0000] information/ConfigItem: Instantiated 1 Comment.
[2018-06-06 17:35:01 +0000] information/ConfigItem: Instantiated 1 CheckerComponent.
[2018-06-06 17:35:01 +0000] information/ConfigItem: Instantiated 3 Zones.
[2018-06-06 17:35:01 +0000] information/ConfigItem: Instantiated 1 Endpoint.
[2018-06-06 17:35:01 +0000] information/ConfigItem: Instantiated 2 ApiUsers.
[2018-06-06 17:35:01 +0000] information/ConfigItem: Instantiated 1 UserGroup.
[2018-06-06 17:35:01 +0000] information/ConfigItem: Instantiated 212 CheckCommands.
[2018-06-06 17:35:01 +0000] information/ConfigItem: Instantiated 1 IdoPgsqlConnection.
[2018-06-06 17:35:01 +0000] information/ConfigItem: Instantiated 3 TimePeriods.
[2018-06-06 17:35:01 +0000] information/ConfigItem: Instantiated 1 User.
[2018-06-06 17:35:01 +0000] information/ScriptGlobal: Dumping variables to file '/var/cache/icinga2/icinga2.vars'
[2018-06-06 17:35:01 +0000] information/cli: Finished validating the configuration file(s).
elasticsearch.conf:
library "perfdata"

object ElasticsearchWriter "elasticsearch" {
  host = "127.0.0.1"
  port = 9200
  index = "icinga2"
  enable_send_perfdata = true
  flush_threshold = 1024
  flush_interval = 10s
}
 Gillingham
All 8 comments
Can you enable the debuglog for Icinga 2 to check whether there are any insights? Same for Elasticsearch, logs might tell what's going on. Further, please share the exact ES version you're now using so we may have a look :)
 dnsmichi
on 7 Jun 2018
dnsmichi
on 7 Jun 2018
For the elasticsearch logs, nothing in there other than [2018-06-06T20:48:40,888][INFO ][o.e.c.m.MetaDataMappingService] [...] [icinga2-2018.06.06/XmEcHRjAQ-ymRKrt5IHMJA] update_mapping [doc] when icinga2 first starts up , ES version 5.6.4
Enabling the icinga2 debug log and grepping for the ElasticsearchWriter seems to maybe just say that it's hanging forever on the _bulk POST request:
[2018-06-11 16:55:43 +0000] information/ElasticsearchWriter: 'elasticsearch' started.
[2018-06-11 16:55:53 +0000] information/WorkQueue: #7 (ElasticsearchWriter, elasticsearch) items: 0, rate:  0/s (0/min 0/5min 0/15min);
[2018-06-11 16:55:55 +0000] notice/WorkQueue: Spawning WorkQueue threads for 'ElasticsearchWriter, elasticsearch'
[2018-06-11 16:55:55 +0000] debug/ElasticsearchWriter: Add to fields to message list: '{*removed data*}'.
[2018-06-11 16:55:56 +0000] debug/ElasticsearchWriter: Add to fields to message list: '{*removed data*}'.
[2018-06-11 16:56:00 +0000] debug/ElasticsearchWriter: Add to fields to message list: '{*removed data*}'.
[2018-06-11 16:56:01 +0000] debug/ElasticsearchWriter: Add to fields to message list: '{*removed data*}'.
[2018-06-11 16:56:03 +0000] debug/ElasticsearchWriter: Timer expired writing 4 data points
[2018-06-11 16:56:03 +0000] notice/ElasticsearchWriter: Connecting to Elasticsearch on host '127.0.0.1' port '9200'.
[2018-06-11 16:56:03 +0000] debug/ElasticsearchWriter: Sending POST request to 'http://127.0.0.1:9200/icinga2-2018.06.11/doc/_bulk'.
[2018-06-11 16:56:13 +0000] information/WorkQueue: #7 (ElasticsearchWriter, elasticsearch) items: 1, rate: 0.0666667/s (4/min 4/5min 4/15min); empty in 10 seconds
[2018-06-11 16:56:23 +0000] information/WorkQueue: #7 (ElasticsearchWriter, elasticsearch) items: 5, rate: 0.0666667/s (4/min 4/5min 4/15min); empty in 12 seconds
[2018-06-11 16:56:33 +0000] information/WorkQueue: #7 (ElasticsearchWriter, elasticsearch) items: 9, rate: 0.0666667/s (4/min 4/5min 4/15min); empty in 22 seconds
[2018-06-11 16:56:43 +0000] information/WorkQueue: #7 (ElasticsearchWriter, elasticsearch) items: 12, rate: 0.0666667/s (4/min 4/5min 4/15min); empty in 39 seconds
[2018-06-11 16:56:53 +0000] information/WorkQueue: #7 (ElasticsearchWriter, elasticsearch) items: 13, rate: 0.0666667/s (4/min 4/5min 4/15min); empty in 2 minutes and 9 seconds
[2018-06-11 16:57:03 +0000] information/WorkQueue: #7 (ElasticsearchWriter, elasticsearch) items: 17, rate:  0/s (0/min 4/5min 4/15min); empty in 42 seconds
[2018-06-11 16:57:13 +0000] information/WorkQueue: #7 (ElasticsearchWriter, elasticsearch) items: 19, rate:  0/s (0/min 4/5min 4/15min); empty in 1 minute and 35 seconds
[2018-06-11 16:57:23 +0000] information/WorkQueue: #7 (ElasticsearchWriter, elasticsearch) items: 24, rate:  0/s (0/min 4/5min 4/15min); empty in 48 seconds
[2018-06-11 16:57:33 +0000] information/WorkQueue: #7 (ElasticsearchWriter, elasticsearch) items: 26, rate:  0/s (0/min 4/5min 4/15min); empty in 2 minutes and 10 seconds
[2018-06-11 16:57:43 +0000] information/WorkQueue: #7 (ElasticsearchWriter, elasticsearch) items: 29, rate:  0/s (0/min 4/5min 4/15min); empty in 1 minute and 36 seconds
Not sure why the POST would hang, I can curl the ES index and that bulk request, though sending no data fine:
$ curl http://127.0.0.1:9200/icinga2-2018.06.11/doc/_bulk
{"_index":"icinga2-2018.06.11","_type":"doc","_id":"_bulk","found":false}
Hmm, strange. I'll need to reproduce this, might be related to fixes in 2.8.2. Thanks for reporting.
dnsmichi
on 15 Jun 2018
Hmm, I don't see this inside the Vagrant box "elastic" with a couple of more random services and metrics (v2.8.4-745-g4eb5b09).
# This file is managed by Puppet. DO NOT EDIT.
library "perfdata"


object ElasticsearchWriter "elasticsearch"  {
  host = "localhost"
  port = 9200
  index = "icinga2"
  enable_send_perfdata = true
  flush_interval = 10s
  flush_threshold = 1024
  enable_tls = false
}
Right on, this is 6.2.3 (I know that 6.3 was released yesterday, did not test it yet).
[root@icinga2-elastic ~]# curl http://localhost:9200
{
  "name" : "icinga2-elastic-elastic-es",
  "cluster_name" : "elastic",
  "cluster_uuid" : "Mp5GGDrqRRK5J-kQ_FbxcQ",
  "version" : {
    "number" : "6.2.3",
    "build_hash" : "c59ff00",
    "build_date" : "2018-03-13T10:06:29.741383Z",
    "build_snapshot" : false,
    "lucene_version" : "7.2.1",
    "minimum_wire_compatibility_version" : "5.6.0",
    "minimum_index_compatibility_version" : "5.0.0"
  },
  "tagline" : "You Know, for Search"
}
The timer should catch up every 10s, like here
[2018-06-15 12:00:58 +0200] debug/ElasticsearchWriter: Sending POST request to 'http://localhost:9200/icinga2-2018.06.15/doc/_bulk'.
[2018-06-15 12:01:08 +0200] debug/ElasticsearchWriter: Sending POST request to 'http://localhost:9200/icinga2-2018.06.15/doc/_bulk'.
[2018-06-15 12:01:18 +0200] debug/ElasticsearchWriter: Sending POST request to 'http://localhost:9200/icinga2-2018.06.15/doc/_bulk'.
[2018-06-15 12:01:28 +0200] debug/ElasticsearchWriter: Sending POST request to 'http://localhost:9200/icinga2-2018.06.15/doc/_bulk'.
[2018-06-15 12:01:38 +0200] debug/ElasticsearchWriter: Sending POST request to 'http://localhost:9200/icinga2-2018.06.15/doc/_bulk'.
[2018-06-15 12:01:48 +0200] debug/ElasticsearchWriter: Sending POST request to 'http://localhost:9200/icinga2-2018.06.15/doc/_bulk'.
[2018-06-15 12:01:58 +0200] debug/ElasticsearchWriter: Sending POST request to 'http://localhost:9200/icinga2-2018.06.15/doc/_bulk'.
[2018-06-15 12:02:08 +0200] debug/ElasticsearchWriter: Sending POST request to 'http://localhost:9200/icinga2-2018.06.15/doc/_bulk'.
[2018-06-15 12:02:19 +0200] debug/ElasticsearchWriter: Sending POST request to 'http://localhost:9200/icinga2-2018.06.15/doc/_bulk'.
[2018-06-15 12:02:29 +0200] debug/ElasticsearchWriter: Sending POST request to 'http://localhost:9200/icinga2-2018.06.15/doc/_bulk'.
[2018-06-15 12:02:39 +0200] debug/ElasticsearchWriter: Sending POST request to 'http://localhost:9200/icinga2-2018.06.15/doc/_bulk'.
Can you check whether there's a hanging TCP connection to ES e.g. with netstat or tcpdump?
dnsmichi
on 15 Jun 2018
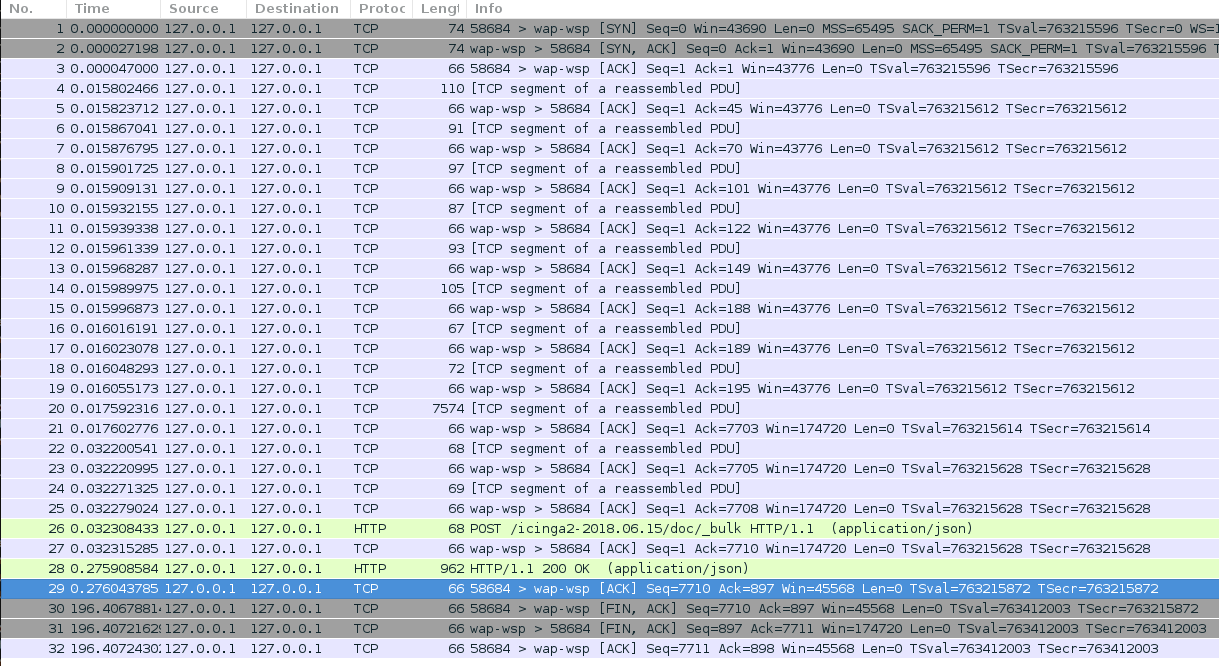
I'm not super familiar with tcpdump, but opening up the pcap in wireshark, I see ~25 starting packets, then a HTTP POST, an ACK and the HTTP 200 OK response on first icinga2 startup. After that, nothing until I shut down icinga2 (which takes a rather long time: time sudo systemctl stop icinga2
0.963u 0.575s 1:31.63 1.6% 0+0k 0+0io 0pf+0w)
Gillingham
on 15 Jun 2018
Even worse: Ctrl-C doesn't shut icingad down, it keeps logging until all ES docs are written (which will never happen).
 Al2Klimov
on 19 Jun 2018
Al2Klimov
on 19 Jun 2018
Same problem as now with #6242, will debug that this week even further with @Al2Klimov. Thanks for reporting @Gillingham :)
dnsmichi
on 19 Jun 2018
Note: I ran I2 w/ the last commit overnight. Works.
Al2Klimov
on 21 Jun 2018
Related issues
 seventh-chord
·
5Comments
seventh-chord
·
5Comments
 dbu1986
·
5Comments
Al2Klimov
·
6Comments
dbu1986
·
5Comments
Al2Klimov
·
6Comments
 xeiss
·
6Comments
xeiss
·
6Comments
 ak2766
·
7Comments
ak2766
·
7Comments
Most helpful comment
Same problem as now with #6242, will debug that this week even further with @Al2Klimov. Thanks for reporting @Gillingham :)