I3status-rust: Music block ramps up updates/sec over time, causing increasing CPU usage
I use the most recent git version of i3status-rust. On my 8 threaded desktop, the i3bar process shows an ever increasing CPU usage.
# ps -ewwo %cpu,args --sort=-%cpu | head
%CPU COMMAND
 8.0 i3bar --bar_id=bar-0 --socket=/run/user/$UID/i3/ipc-socket.14743
 4.6 /usr/lib/firefox/firefox
 3.1 /usr/lib/firefox/firefox ...
 2.5 /usr/lib/Xorg -nolisten tcp :0 ...
 2.4 /usr/share/spotify/spotify
 1.5 /usr/lib/thunderbird/thunderbird
 1.4 i3status-rs /home/$USER/.config/i3/status.toml
So since start the average was 8%, but at the time of writing, in htop it hovers around 17%.
Restarting i3 in-place, which restarts i3bar, brings its CPU usage back down to below 1%.
Everything else works just fine btw.
My config
theme = "solarized-dark"
[icons]
name = "awesome"
[icons.overrides]
cpu = "⚡"
music = ""

[[block]]
block = "music"
player = "spotify"
max_width = 36
buttons = ["play", "next"]

[[block]]
block = "disk_space"
path = "/"
alias = "/"
info_type = "available"
unit = "GB"
interval = 20

[[block]]
name = "networkmanager"

[[block]]
block = "memory"
format_mem = "{Mug}GB({Mup}%)"
format_swap = "{SUg}GB({SUp}%)"
display_type = "memory"
icons = true
clickable = true
interval = 5
warning_mem = 80
warning_swap = 80
critical_mem = 95
critical_swap = 95

[[block]]
block = "cpu"
info = 15
warning = 50
interval = 1
frequency = true

[[block]]
block = "load"
format = "{1m} {5m}"
interval = 3

[[block]]
block = "weather"
format = "{weather} {temp}° {wind} m/s {direction}"
service = { name = "openweathermap", api_key = "<secret>", city_id = "<my_city_id>", units = "metric" }

[[block]]
block = "time"
format = "%a %d/%m %T"
timezone = "Europe/Berlin"
interval = 60

[[block]]
block = "sound"
step_width = 3
on_click = "pavucontrol"

[[block]]
block = "custom"
command = "/home/$USER/bin/xkb-layout-icon.sh"
interval = 1
on_click = "xkb-switch -n"

[[block]]
block = "pacman"
interval = 3600
Custom block script /home/$USER/bin/xkb-layout-icon.sh:
#!/bin/bash
case $(xkb-switch) in
us)
  printf '🇺🇳' ;;
de)
  printf '🍺' ;;
esac
My guess: For some reason, the data that i3status-rs passes to i3bar is getting bigger and bigger, so it has to process more and more data. But that's just a wild guess.
 sebastianst
All 19 comments
It might be worth investigating whether this is caused by a specific block on your system. You could try disabling various blocks to see if it affects CPU usage. Do you know approximately how long it takes for CPU usage to escalate?
 atheriel
on 16 Oct 2018
atheriel
on 16 Oct 2018
This sounds a lot like what greshake in #176 is describing.
I'm suffering from the same issue btw which is not surprising as I use more or less the same config as sebastianst.
 TKussel
on 17 Oct 2018
TKussel
on 17 Oct 2018
I'm not seeing increased CPU usage, but I have a pretty different config. It will likely take me (or another collaborator) a while to try and reproduce this issue, so for anyone reading the thread I'd appreciate comments or suggestions.
To hazard a wild guess I'd start by looking at the music block.
atheriel
on 17 Oct 2018
It seems indeed to be the music block. Disabling it keeps i3bar's CPU usage below 0.7%. But why is it such an effort for i3bar to scan 2 updates per second? And why is the CPU consumption increasing? I started i3status-rs manually in the terminal and I don't see any weird output.
sebastianst
on 18 Oct 2018
I don't use the music block and experience the same problem. My best guess is the custom block, but I don't know why, yet. The direct output of i3status-rs looks inconspicuous as well.
TKussel
on 18 Oct 2018
Does dbus-daemon have comparatively high usage too?
If not then might not be the music block.
> pstree -p | rg swaybar 45.819s|21:40:16
|-login(789)---fish(1129)---sway(17631)-+-swaybar(23968)---i3status-rs(23969)-+-{i3status-rs}(23970)
> ps -ewwo "%cpu,args" --sort=-%cpu | rg swaybar 0.028s|21:40:34
3.3 swaybar -b bar-0
0.0 rg swaybar
> sudo strace -p 23969 -c 839.447s|21:38:22
strace: Process 23969 attached
^Cstrace: Process 23969 detached
% time seconds usecs/call calls errors syscall
------ ----------- ----------- --------- --------- ----------------
86.25 0.614153 19811 31 wait4
3.54 0.025195 15 1580 152 futex
3.01 0.021417 3 5718 write
1.83 0.013007 13 984 clone
1.39 0.009909 7 1396 poll
1.32 0.009382 3 2668 1334 recvmsg
1.15 0.008179 6 1334 sendmsg
0.63 0.004496 7 573 31 read
0.32 0.002245 8 260 openat
0.19 0.001345 3 384 close
0.11 0.000764 17 44 stat
0.07 0.000478 2 186 prlimit64
0.06 0.000421 4 93 ioctl
0.05 0.000338 5 62 pipe2
0.04 0.000281 9 31 munmap
0.03 0.000209 3 62 rt_sigprocmask
0.02 0.000173 5 31 mmap
0.01 0.000066 16 4 statfs
0.00 0.000009 9 1 getrandom
------ ----------- ----------- --------- --------- ----------------
100.00 0.712067 15442 1517 total
 ammgws
on 18 Oct 2018
ammgws
on 18 Oct 2018
I don't use the music block and experience the same problem. My best guess is the custom block, but I don't know why, yet. The direct output of
i3status-rslooks inconspicuous as well.
Strange, I have checked it again, and it definitely is the music block for me. The custom block doesn't cause high CPU usage.
And @ammgws dbus-daemon is close to 0.0% CPU usage, also with the music block enabled.
sebastianst
on 18 Oct 2018
# pstree -p | grep i3bar
|-i3bar(26875)---i3status-rs(26881)-+-{i3status-rs}(26882)
# sudo strace -p 26875 -c
strace: Process 26875 attached
^Cstrace: Process 26875 detached
% time seconds usecs/call calls errors syscall
------ ----------- ----------- --------- --------- ----------------
53.75 0.024277 0 47559 10033 read
18.03 0.008142 0 10101 epoll_wait
15.18 0.006857 0 20110 writev
8.50 0.003840 0 20110 poll
4.43 0.002001 0 10135 10079 recvmsg
0.11 0.000051 2 19 write
------ ----------- ----------- --------- --------- ----------------
100.00 0.045168 108034 20112 total
strace ran for 10 minutes. Quite a few read and recvmsg errors. At the time of this check, i3bar had an average CPU usage of 3.4% whereas i3status-rs had 0.8%.
sebastianst
on 18 Oct 2018
If I understand this correctly, it looks like the music block is causing quite a number of read operations for i3bar, right?
atheriel
on 18 Oct 2018
Looks like. For comparison, without the music block, over ~10 minutes:
# sudo strace -p 8234 -c
strace: Process 8234 attached
^Cstrace: Process 8234 detached
% time seconds usecs/call calls errors syscall
------ ----------- ----------- --------- --------- ----------------
53.83 0.002975 0 3961 973 read
21.31 0.001178 1 993 epoll_wait
12.16 0.000672 0 1962 writev
8.74 0.000483 0 1962 poll
3.29 0.000182 0 1000 993 recvmsg
0.67 0.000037 4 8 write
------ ----------- ----------- --------- --------- ----------------
100.00 0.005527 9886 1966 total
So it's less than a tenth of read and recvmsg calls. But interestingly, the CPU usage is even less than a tenth, at only 0.1% (was at 3.4% and steadily increasing in the last post).
# ps -ewwo "%cpu,args" --sort=-%cpu | grep i3
0.1 i3bar --bar_id=bar-0 --socket=/run/user/$UID/i3/ipc-socket.14743
0.0 i3status-rs /home/$USER/.config/i3/status.toml
0.0 i3 -a --restart /run/user/$UID/i3/restart-state.14743
But still, i3bar consumes more than the status application itself.
sebastianst
on 19 Oct 2018
Is it possible that the music block is spamming updates? That would cause i3bar to read and re-render much more often, explaining the high CPU usage of the bar itself.
For instance, if you run i3status-rs in a terminal, does it update much more than once per second?
atheriel
on 20 Oct 2018
I checked and I have 3-5 updates per second when the title is rotating and a little less if it isn't. I didn't check it over a long time, only about 20 seconds. That's the music block twice a second but then also the other blocks seemingly not in sync with the half-second update cycle of the rotating music block. Is it possible that there's no global clock that makes blocks push their updates synchronously? It would be good to have a (configurable) upper bound of updates per second to i3bar.
sebastianst
on 23 Oct 2018
I did a deeper dive with pv (pipe viewer) and the lines/second are indeed increasing. It seems that it increases with every new song that has a title that makes rotation necessary, and then stays at that update rate for that song. So the 2nd song showed a max of around 19 updates/sec and the song after already 28, then 36, ...
Here's the command I used and observed for four songs now:
i3status-rs .config/i3/status.toml | pv -l -i 5 -rat >/dev/null
Example outputs (elapsed time; current rate over 5 sec (-i 5); total average rate):
0:12:55 [35.2 /s] [13.6 /s]
1:12:55 [ 140 /s] [42.9 /s]
1:15:20 [ 184 /s] [45.1 /s]
I did a deeper dive with pv (pipe viewer) and the lines/second are indeed increasing.
Thank you, that's exactly the kind of detective work this issue needed. :+1:
atheriel
on 24 Oct 2018
I discovered an issue most likely related to this one, though, it may affect all blocks as far as I'm in the right. So, without the music block CPU usage seemed to stay low at all times for me until a few hours later, I noticed it ramped up again. I didn't do any sophisticated dedetective work - I simply reloaded the Sway session and started rapidly clicking on the memory block until the CPU usage for swaybar reached stable 10%. Now I can observe the memory block update at the same, constant, near real-time rate.
 ghost
on 7 Nov 2018
ghost
on 7 Nov 2018
Do you still experience this issue on latest master?
 rtxm
on 3 Dec 2018
rtxm
on 3 Dec 2018
Swaybar usage looks good to me now.
(Could give a conclusive answer by running the pre-fix build as well to compare but I don't have the time for that at the moment.)
ammgws
on 23 Dec 2018
Seems to work fine for me, too, meanwhile.
 blizzz
on 24 Dec 2018
blizzz
on 24 Dec 2018
Just noticed today that i3status-rs is pegging a core. Haven't been able to pinpoint what is causing it but posting here since might be related:
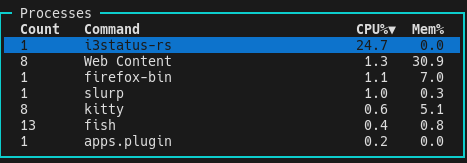
strace output:
% time     seconds  usecs/call     calls    errors syscall
------ ----------- ----------- --------- --------- ----------------
 82.00    0.927018       11734        79           wait4
 10.26    0.116009         107      1083       541 futex
  2.68    0.030284          11      2558       107 read
  1.47    0.016672          13      1213           openat
  1.18    0.013300          71       186           poll
  0.93    0.010551           3      3342           write
  0.59    0.006673          15       436           statx
  0.30    0.003364           2      1529           close
  0.30    0.003349           1      2168           sched_yield
  0.29    0.003333          42        79           clone
  0.00    0.000000           0        79           mmap
  0.00    0.000000           0        79           munmap
  0.00    0.000000           0       158           rt_sigprocmask
  0.00    0.000000           0       237           ioctl
  0.00    0.000000           0        22           statfs
  0.00    0.000000           0         1         1 restart_syscall
  0.00    0.000000           0       158           pipe2
  0.00    0.000000           0       474           prlimit64
------ ----------- ----------- --------- --------- ----------------
100.00    1.130553                 13881       649 total
pv output on a new instance seems OK.
Don't think it's possible to check the existing process though
0:00:05 [2.20 /s] [2.20 /s]
0:01:20 [2.40 /s] [2.50 /s]
config file: https://gist.github.com/ammgws/6eea559aa187d68fcacacac0c02274cb
ammgws
on 21 Jan 2020
Related issues
 oschoudhury
·
6Comments
oschoudhury
·
6Comments
 boi4
·
3Comments
boi4
·
3Comments
 marvin-steinke
·
4Comments
marvin-steinke
·
4Comments
 Thra11
·
6Comments
Thra11
·
6Comments
 yawpitch
·
4Comments
yawpitch
·
4Comments
Most helpful comment
I did a deeper dive with
pv(pipe viewer) and the lines/second are indeed increasing. It seems that it increases with every new song that has a title that makes rotation necessary, and then stays at that update rate for that song. So the 2nd song showed a max of around 19 updates/sec and the song after already 28, then 36, ...Here's the command I used and observed for four songs now:
Example outputs (elapsed time; current rate over 5 sec (
-i 5); total average rate):