Https-everywhere: Release 2018.4.11 forthcoming
Type: other
cc @jsha @pde @J0WI @diracdeltas @jeremyn @gloomy-ghost @Bisaloo
The 2018.4.3 release went super smoothly. I'd like to punch up the periodicity to 24 hours between ruleset checks (down from 48).
This should not increase bandwidth usage very much, since the ruleset checks are so small. It will, however, increase the number of requests by a factor of about two (give or take, accounting for browsers that are closed or that haven't downloaded the newest rulesets yet).
 Hainish
All 8 comments
Here's a neat graph I took yesterday from the Fastly control panel. Note that the graphs look almost identical, until the point 48 hours in, where there is a spike in requests (but the bandwidth usage continues to go down). This corresponds to what we would expect.
I suspect the first two initial bursts correspond to being listed on AMO, and then being listed on CWS (or vice-versa, I'm not sure). The next set of waves probably correspond to global user base active periods.
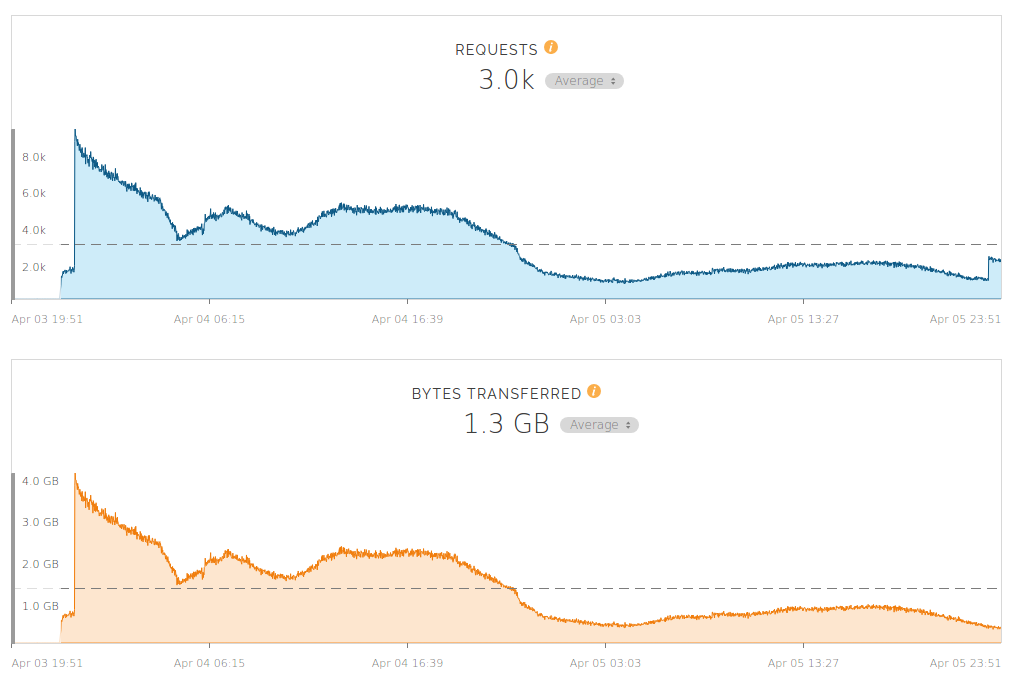
The x axis is time, a data point every minute. The y axis is requests (or GB of downloads for the second graph) every minute. Fastly kicked some major ass for this launch, not skipping a beat with nearly 9M requests and nearly 4TB of data in the first 48 hours.
Hainish
on 6 Apr 2018
On a related note, how often is https-rulesets.org synced with the git master branch?
 Bisaloo
on 7 Apr 2018
Bisaloo
on 7 Apr 2018
@Bisaloo I've been treading lightly this week, to both limit interference when observing the graph as well as to not put too much load on the CDN all at once. But I think twice weekly is probably a good rule of thumb.
Hainish
on 7 Apr 2018
@Hainish can https-rulesets.org also be used by downstream projects? It would be great to have some documentation about it.
 J0WI
on 7 Apr 2018
J0WI
on 7 Apr 2018
@J0WI yes it can. Can you open a ticket and tag me in it?
On April 7, 2018 6:46:24 AM PDT, J0WI notifications@github.com wrote:
@Hainish can
https-rulesets.orgalso be used by downstream projects?
It would be great to have some documentation about it.--
You are receiving this because you were mentioned.
Reply to this email directly or view it on GitHub:
https://github.com/EFForg/https-everywhere/issues/15090#issuecomment-379470485
--
Sent from my Android device with K-9 Mail. Please excuse my brevity.
Hainish
on 7 Apr 2018
=> #15109
J0WI
on 7 Apr 2018
Bumping this until tomorrow.
Hainish
on 10 Apr 2018
Release made.
Hainish
on 12 Apr 2018
Related issues
Hainish
·
4Comments
 raman325
·
4Comments
raman325
·
4Comments
 jsha
·
3Comments
jsha
·
3Comments
 Lissy93
·
4Comments
Lissy93
·
4Comments
 Jochen-A-Fuerbacher
·
3Comments
Jochen-A-Fuerbacher
·
3Comments
Most helpful comment
Here's a neat graph I took yesterday from the Fastly control panel. Note that the graphs look almost identical, until the point 48 hours in, where there is a spike in requests (but the bandwidth usage continues to go down). This corresponds to what we would expect.
I suspect the first two initial bursts correspond to being listed on AMO, and then being listed on CWS (or vice-versa, I'm not sure). The next set of waves probably correspond to global user base active periods.
The x axis is time, a data point every minute. The y axis is requests (or GB of downloads for the second graph) every minute. Fastly kicked some major ass for this launch, not skipping a beat with nearly 9M requests and nearly 4TB of data in the first 48 hours.