Horizon: Performance hit after upgrade to 3.2.1
- Horizon Version: 3.2.1
- Laravel Version: 5.8.17
- PHP Version: 7.2.18
- Redis Driver & Version: predis 1.1.1
- Database Driver & Version: MySQL 5.7.25
Description:
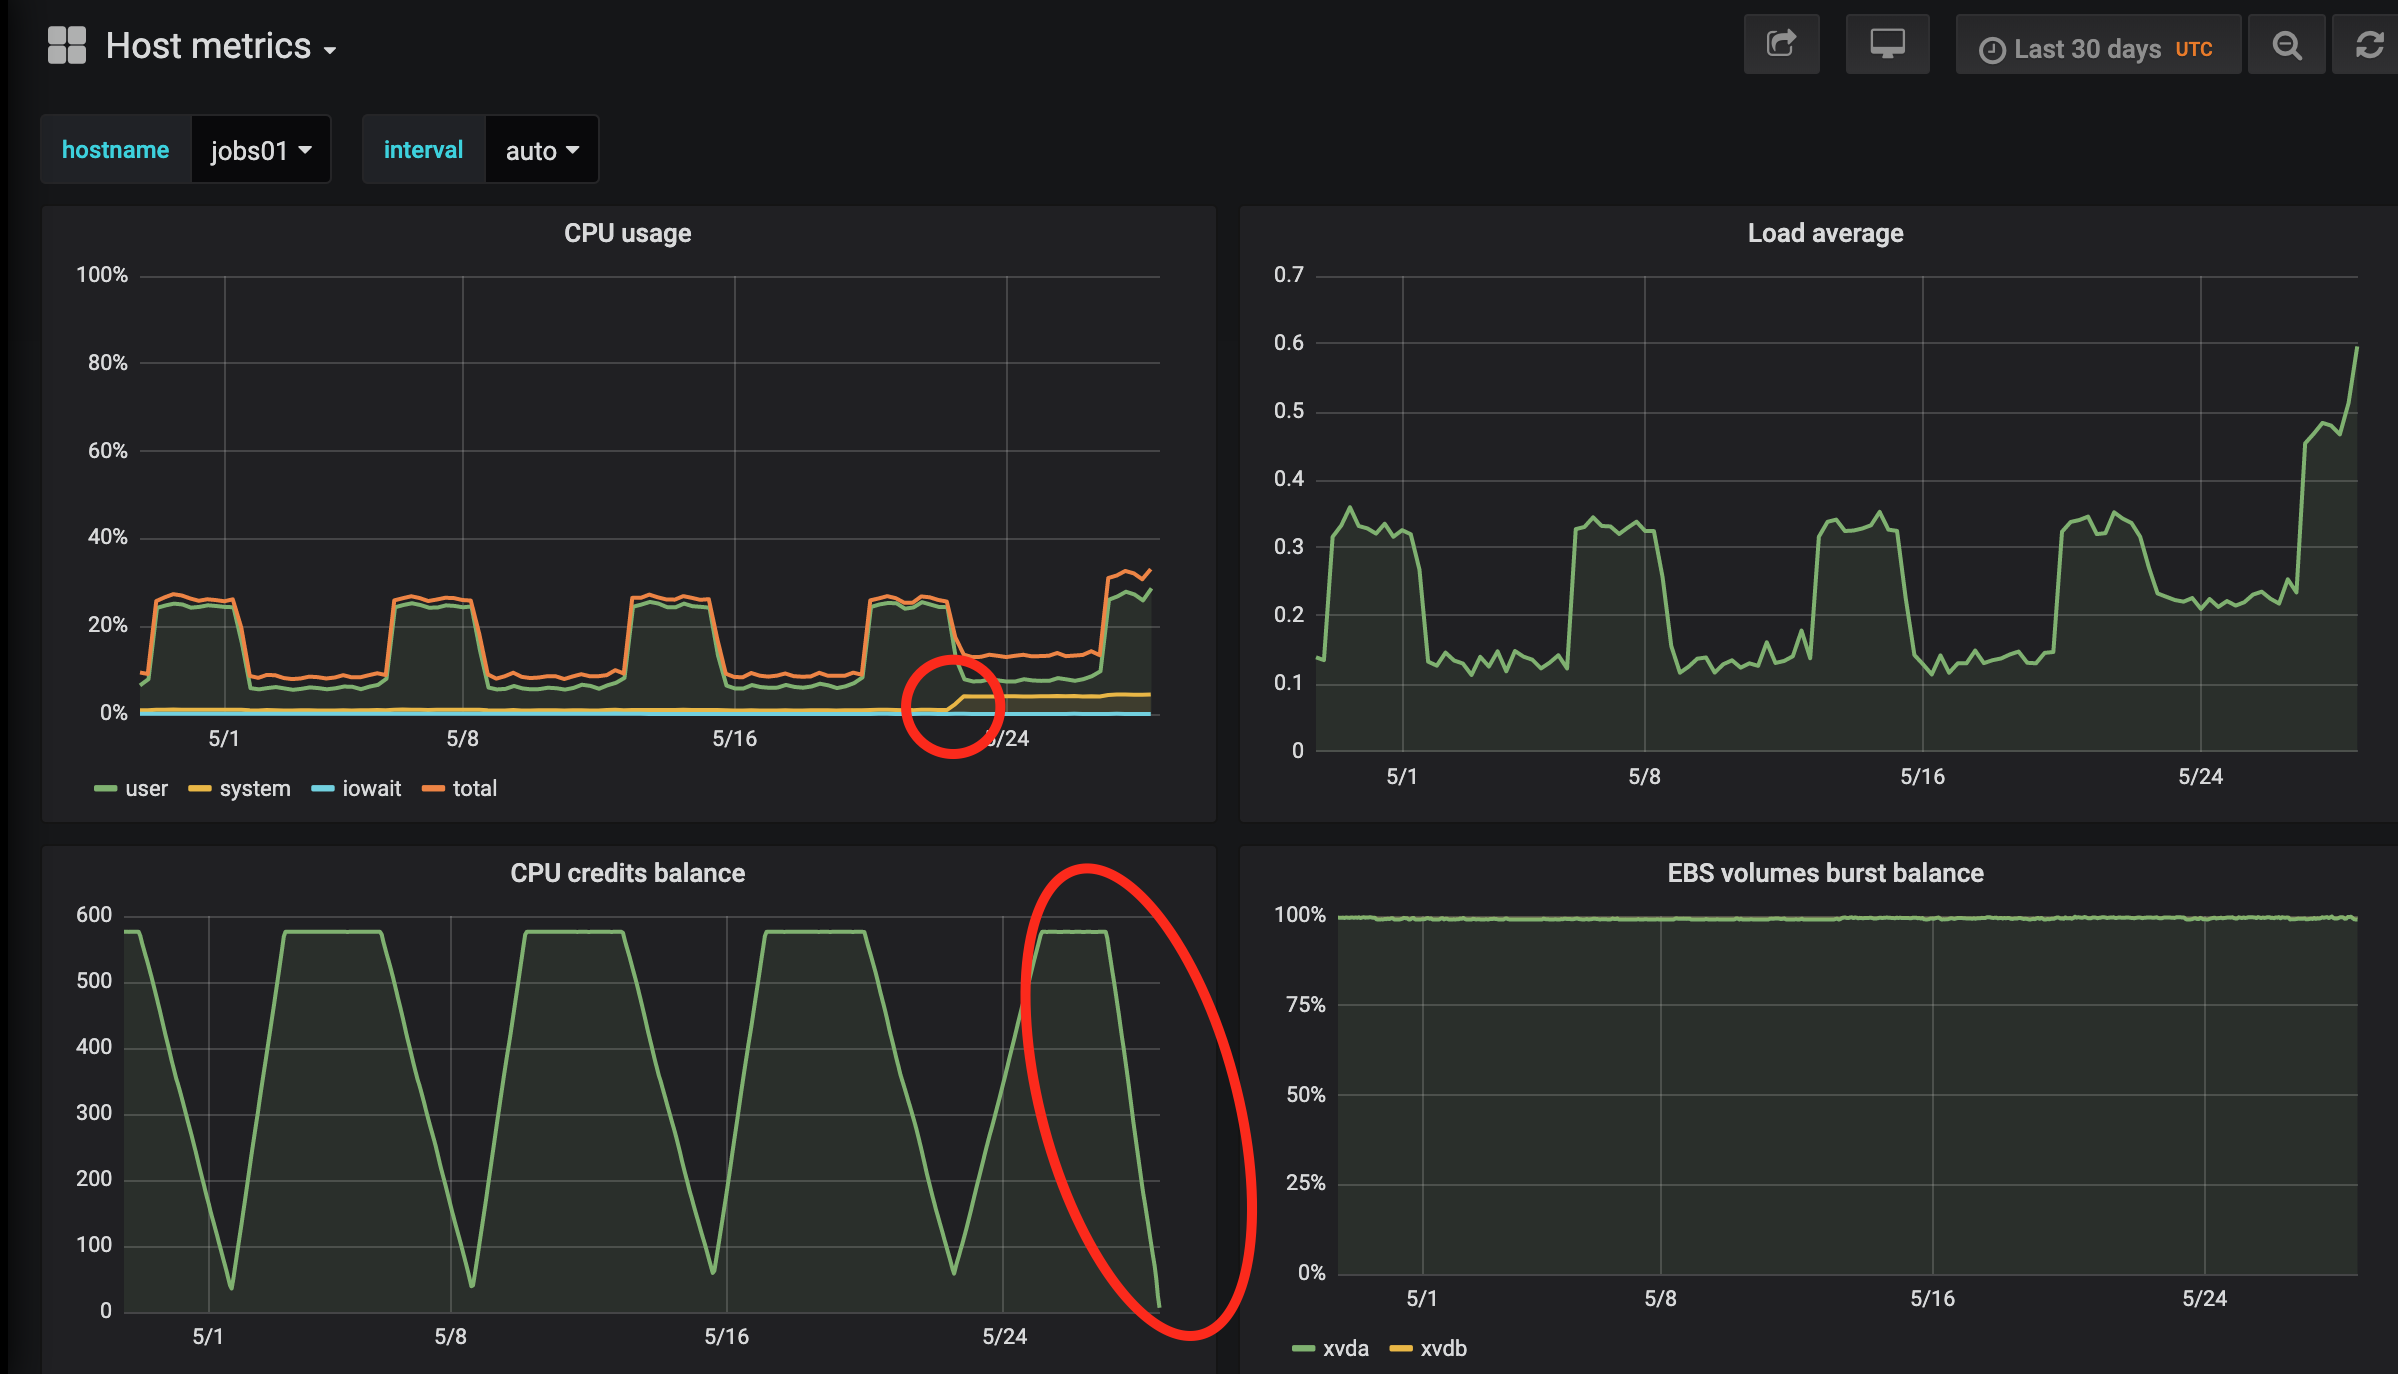
I noticed a performance hit in production after upgrading to Horizon 3.2.1, which is probably in relation to https://github.com/laravel/horizon/pull/589. This is on a EC2 t2 instance, with constant workload, the hit is an additional 5-6% of CPU usage.
See graph below, we upgraded to 3.2.1 on May 22 (you will notice also that the CPU credits went down to zero way faster after the upgrade):
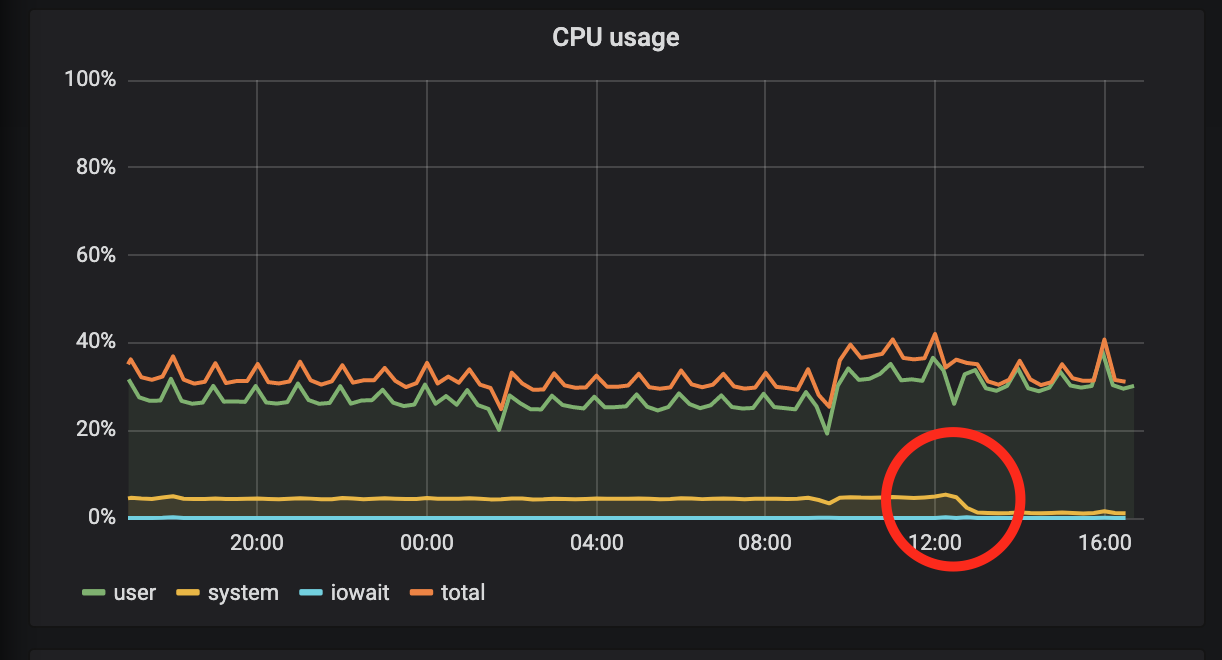
And this graph is after reverting to 3.1.2:
Steps To Reproduce:
Upgrade Horizon from 3.1.2 to 3.2.1.
 CyrilMazur
All 8 comments
Can you check if this is related to the scheduler or one of the other processes?
 AJenbo
on 29 May 2019
AJenbo
on 29 May 2019
How can I check that?
CyrilMazur
on 30 May 2019
I think this may be because it now calls ps twice, once to find out if it need to auto-scale and once to get the current system load. Unfortunately on my system the performance difference is so minute that I'm unable to tell the difference.
I have 3 options for possible improvements.
1: Differentiate the two calls so that the auto-scaler only get the list of commands and not CPU and mem load.
2: Only call ps once and then store the values in the class for the telementry
3: Tightly couple telementry and autoscaling
The pros:
1: Only getting the relevant data for the caller is probably good idea
2: Only one call will be made each tick
3: Only one call will be made each tick
The cons:
1: It is unclear from my tests if ps collects less data or simply just dosen't return it, so the savings might be negligible.
2: If caller A is no longer called each tick in a later version then caller B will get stale data
3: Tightly coupling things is a bad idea
AJenbo
on 6 Jun 2019
Option 4: boolean to enable / disable telemetry?
For option 1, if you can give me an example of ps command, I can try to benchmark it on my EC2 t2 instance.
CyrilMazur
on 7 Jun 2019
exec ps axo %cpu,%mem,command | grep "supervisor=SomeHorizonName" | grep -v "grep"
vs
exec ps axo command | grep "supervisor=SomeHorizonName" | grep -v "grep"
AJenbo
on 7 Jun 2019
Over 50,000 iterations, no significant difference...
➜  time ./test1.sh
./test1.sh  83.36s user 146.00s system 78% cpu 4:53.98 total
➜  time ./test2.sh
./test2.sh  80.47s user 152.67s system 78% cpu 4:56.86 total
Hmm less then 4% increased performance dosent look promising for option 1. There would also be a reduction in time spent parsing the result, since scaling would only need the number of lines. But I wouldn't expect this to much of a performance issue either.
Currently this only appears to cost 0.16% cpu at the tick rate on the given system so perhaps more then just ps is to blame here.
AJenbo
on 8 Jun 2019
The original PR that caused the performance hit was reverted.
 driesvints
on 14 Jun 2019
driesvints
on 14 Jun 2019
Related issues
 sojeda
·
5Comments
sojeda
·
5Comments
 etiennellipse
·
3Comments
etiennellipse
·
3Comments
 okaufmann
·
3Comments
okaufmann
·
3Comments
 mahdiahmadi73
·
3Comments
mahdiahmadi73
·
3Comments
 dmitryuk
·
3Comments
dmitryuk
·
3Comments
Most helpful comment
The original PR that caused the performance hit was reverted.