Hono: Re-design "messaging" panels in Dashboard
It is pretty confusing IMHO to have the "messaging" panels in the top of the Grafana dashboards now that the messaging component is actually not being used anymore.
My proposal would be to simply remove them.
 ctron
ctron
All 15 comments
The fact that we remove Hono Messaging doesn't mean that the information is no longer relevant. It only means that it will now be harder to get the aggregated view over all protocol adapters, i.e. we now need to gather together the throughput data from all the adapters (which provide this information as well), don't we?
 sophokles73
on 16 Jul 2018
sophokles73
on 16 Jul 2018
But we do have those as well .... But if you have a look at the current dashboard, it will look like this … always:
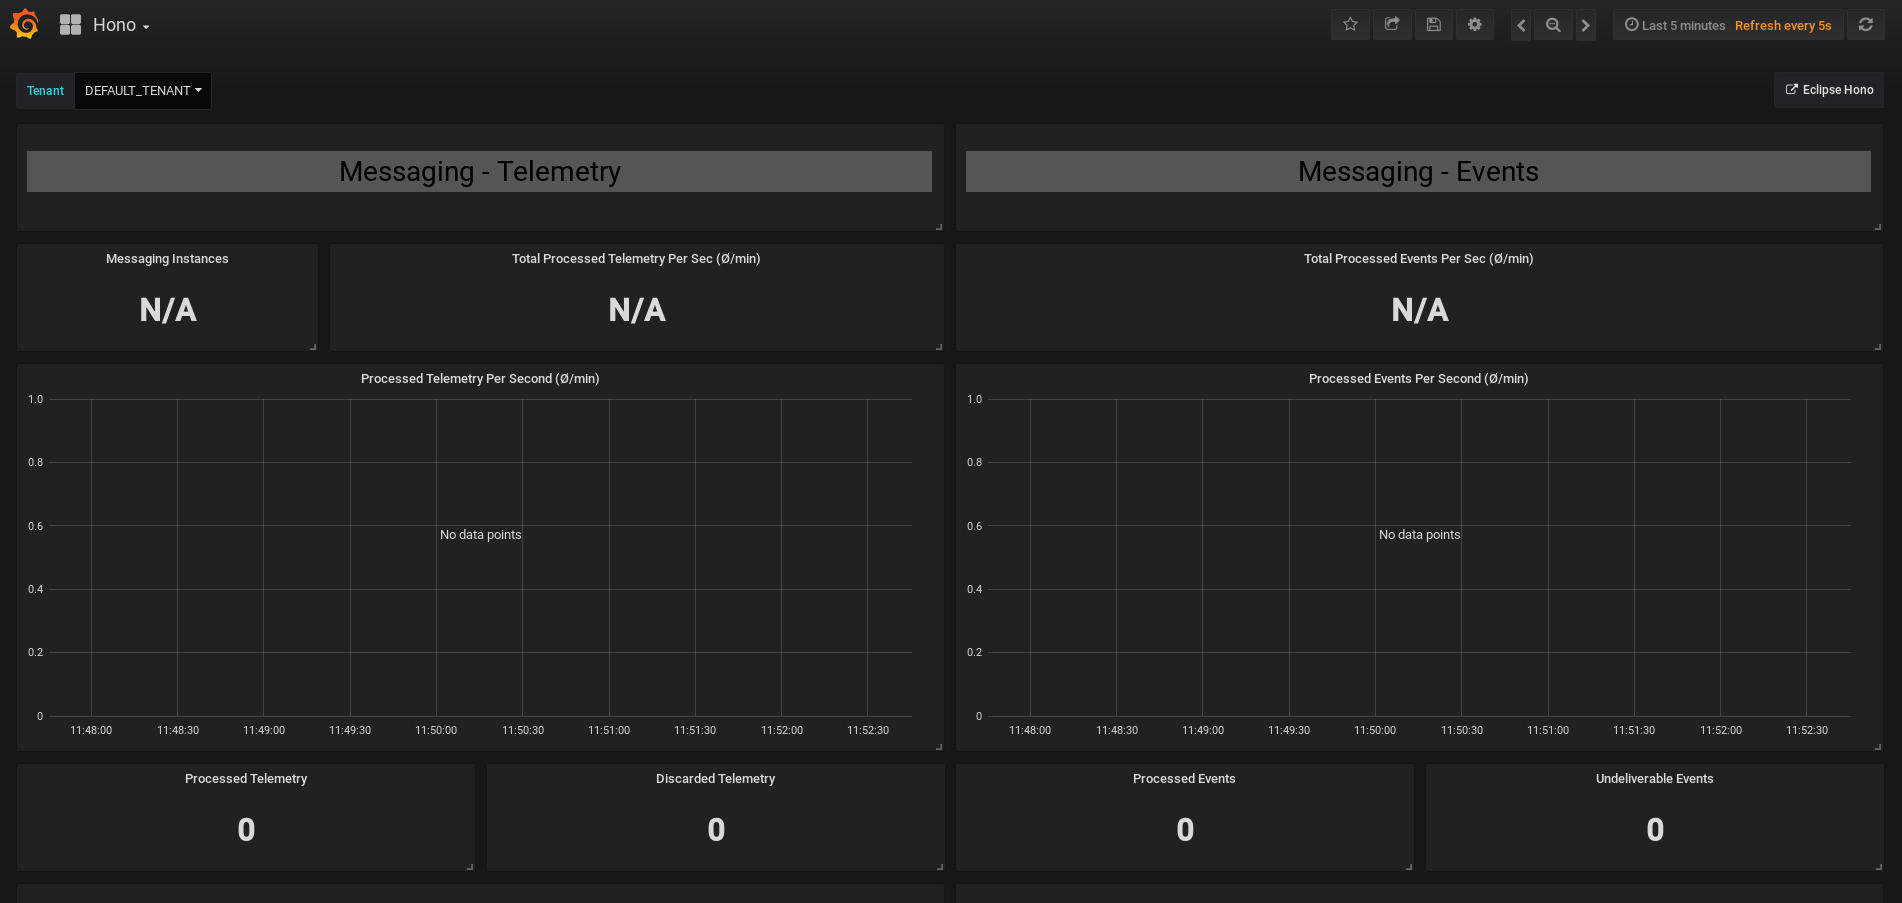
Unless you scroll down and then you will see the actual information:

So I am not sure how useful the information above (first screenshot) is. It will always be "N/A". At least put it last in the dashboard.
ctron
on 17 Jul 2018
The graphs at the top show the no. of messages per tenant (aggregated across all adapter types) whereas the graphs at the bottom show the no. of messages per protocol adapter. FMPOV the aggregated view makes a lot of sense, we only need to make sure that it actually shows the data. When we omit Hono Messaging from the deployment, then the underlying queries need to be changed. But I do not see why we should remove the panels ...
sophokles73
on 17 Jul 2018
Ok, now I understand what you want. But wouldn't it make sense to use the dashboard from EnMasse for that?
ctron
on 17 Jul 2018
Well, EnMasse is not part of Hono ...
@pellmann @dejanb @ppatierno @sysexcontrol any opinion on this?
sophokles73
on 17 Jul 2018
Well, EnMasse is not part of Hono ...
True.
Why not simply stack the throughput of MQTT + HTTP in a single chart. That would show the whole throughput and helped me always to get a better overview than those current overlapping charts anyway.
ctron
on 18 Jul 2018
I think stacking would also help in the other panels as well:
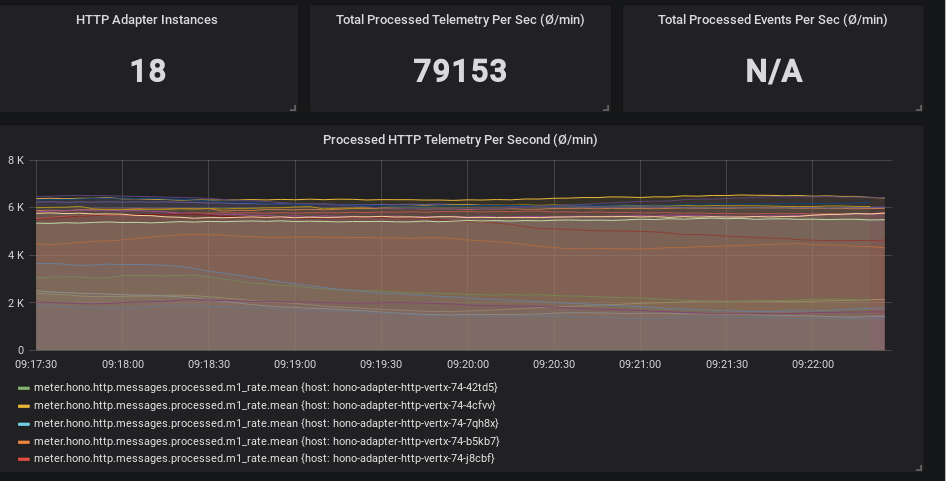
vs

ctron
on 23 Jul 2018
I like the stacking! @pho-enix what do think about this?
 pellmann
on 25 Jul 2018
pellmann
on 25 Jul 2018
For a small number of adapters this might work very well. Typically nobody will use hono on their local dev system with more than two or three instances of an adapter type.
 pho-enix
on 25 Jul 2018
pho-enix
on 25 Jul 2018
@pho-enix If I understand correctly, you are questioning the approach's feasibility in production environments where you might have dozens of instances of e.g. the HTTP adapter running and the "stacked" lines would actually look more like a "filled curve", right?
sophokles73
on 26 Jul 2018
@sophokles73 To my point of view the dashboards only are examples and they should support development and testing of hono. For that purpose the proposed approach looks very good and we should go for it.
We shouldn't consider the "hono at scale" approach. Someone operating hono like that might have their own monitoring system which might be highly custom.
pho-enix
on 26 Jul 2018
Ok, taking a closer look at this, this might be more complex than expected.
Hono doesn't use tags for the metrics, but dedicated metrics names: e.g. meter.hono.http.messages.processed.m1_rate and meter.hono.mqtt.messages.processed.m1_rate for HTTP and MQTT. IIRC this has planned to be changed to use tags, like meter.hono.messages.processed.m1_rate (transport=http, transport=mqtt) instead, but in a future release.
We can work around this in the Grafana dashboards for the charts, by using stacked data series. But we can't really for the single-stats. And from what it looks like to me, summing this up with an InfluxDB query doesn't look trivial, if possible at all.
So my proposal would be to re-schedule this for Hono 0.8, an directly go for tagged metrics instead of wasting any time in fixing the dashboard queries.
ctron
on 16 Aug 2018
@ctron Not sure what to do about this issue. Is this still relevant with all the changes that we have made to the metrics system (and dashboards)?
FMPOV we could simply close this issue, WDYT?
sophokles73
on 18 Feb 2019
@ctron any comment on this one?
sophokles73
on 26 Feb 2019
Yes, closing this is the right thing to do.
ctron
on 26 Feb 2019
Related issues
 kaniyan
·
10Comments
kaniyan
·
10Comments
 bordeuax
·
6Comments
kaniyan
·
5Comments
bordeuax
·
6Comments
kaniyan
·
5Comments
 mhemmeter
·
11Comments
sophokles73
·
4Comments
mhemmeter
·
11Comments
sophokles73
·
4Comments
Most helpful comment
@sophokles73 To my point of view the dashboards only are examples and they should support development and testing of hono. For that purpose the proposed approach looks very good and we should go for it.
We shouldn't consider the "hono at scale" approach. Someone operating hono like that might have their own monitoring system which might be highly custom.