Holoviews: Add example of updating Graph node colors
Would it be possible to update the node colors on Graph?
I'm thinking of making a streamz extension which plots the execution graph and then colors the nodes by if that node is processing data, done processing data, or failed to process the data.
 CJ-Wright
All 14 comments
I'm thinking of making a streamz extension which plots the execution graph and then colors the nodes by if that node is processing data, done processing data, or failed to process the data.
This sounds great and I'd love to see that. I've been meaning to do something similar to visualize execution of holoviews pipelines.
import time
import numpy as np
import pandas as pd
import holoviews as hv
hv.extension('bokeh')

def gen_data():
    return np.random.randint(0, 2, size=10)

def graph(data):
    # Create nodes from 1D array of 'Active' values
    # these are implicitly indexed by the node id
    nodes = hv.Dataset(data, vdims='Active')
    # Create a fully connected network
    edges = [(i, j) for i in range(10) for j in range(10)]

    # Declare options to color by 'Active' value
    opts = dict(color_index='Active', cmap=['Red', 'Blue'])
    ranges = dict(Active=(0, 1), x=(-1.1, 1.1), y=(-1.1, 1.1))
    return hv.Graph((edges, nodes)).options(**opts).redim.range(**ranges)

stream = hv.streams.Pipe(data=np.random.randint(0, 2, size=10))
hv.DynamicMap(graph, streams=[stream])

for i in range(10):
    time.sleep(0.1)
    stream.send(np.random.randint(0, 2, size=10))
Here's a small example that colors the graph nodes depending on a value. The basic idea is to declare the nodes with some value dimension which you color by using the color_index option. In the example above the nodes are just a 1D array of values but you can also supply the explicit positions and the node ids for the nodes if necessary.
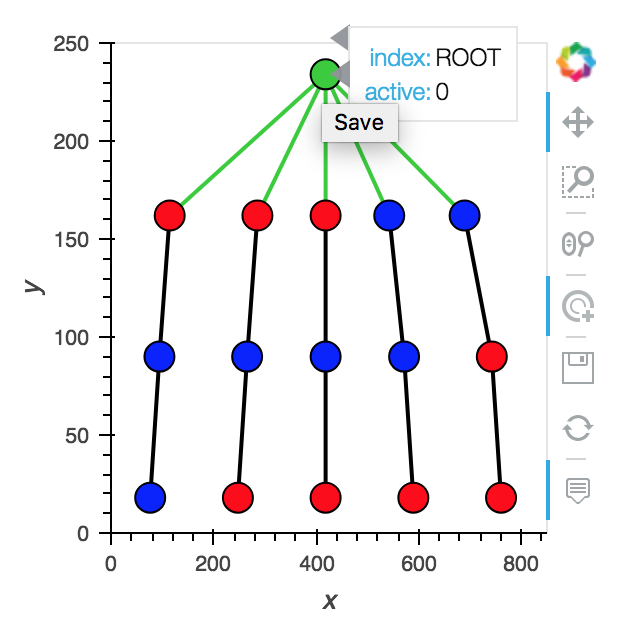
I also just found out that networkx has a pygraphviz extension so you can easily make complex layout algorithms work:
import networkx as nx
from networkx.drawing.nx_agraph import graphviz_layout
G = nx.DiGraph()

G.add_node("ROOT", active=np.random.randint(2))

for i in range(5):
    G.add_node("Child_%i" % i, active=np.random.randint(2))
    G.add_node("Grandchild_%i" % i, active=np.random.randint(2))
    G.add_node("Greatgrandchild_%i" % i, active=np.random.randint(2))

    G.add_edge("ROOT", "Child_%i" % i)
    G.add_edge("Child_%i" % i, "Grandchild_%i" % i)
    G.add_edge("Grandchild_%i" % i, "Greatgrandchild_%i" % i)

g = hv.Graph.from_networkx(G, graphviz_layout, prog='dot')

g.redim.range(x=(0, 850), y=(0, 250)).options(color_index='active', cmap=['red', 'blue'])
 philippjfr
on 12 Jun 2018
philippjfr
on 12 Jun 2018
This looks awesome! I'm very excited to try this out. What is the best way to supply the node positions and ids when updating the colors?
CJ-Wright
on 12 Jun 2018
If you want to define the node positions and ids yourself:
# Tuple of 1D-array columns
hv.Nodes((node_xs, node_ys, node_ids, color_values, ...), vdims=['active', ...])

# Or equivalently with a DataFrame (where each ``?_column`` references a column in the df)
hv.Nodes(df, ['x_column', 'y_column', 'index_column'], ['active_column', ...])

hv.Graph((edges, nodes))
This seems very useful in combination with @philippjfr's recent unicode example --- if marker shape can be controlled directly, then e.g. the node shape and not just the color could easily change, to indicate the state of that node in a more self-evident way. E.g. for a computer network, the icon for the node could change from a sleeping computer to an overheating one, depending on its current status. Is that currently feasible, or does it depend on e.g. https://github.com/ioam/holoviews/issues/768 ?
 jbednar
on 12 Jun 2018
jbednar
on 12 Jun 2018
Ah, so there isn't a way to say "change the color of that node only" I need to pass in the full node-color mapping every time? (this isn't a critique, just a double check)
CJ-Wright
on 12 Jun 2018
Is that currently feasible, or does it depend on e.g. #768 ?
That could probably be made to work but note that #768 has very little to do with it. #768 will add the ability to map column values to arbitrary properties on the glyph, but it will not let you switch between glyphs. Since the unicode example uses a completely different glyph (the text glyph) that is not simply some variation on the marker property that PR will not allow you to switch between them arbitrarily without a lot of special handling. Edit: I suppose #768 is general and does cover that, it's just that the current PR won't handle that and if we want that behavior it will need special handling.
Ah, so there isn't a way to say "change the color of that node only" I need to pass in the full node-color mapping every time?
That is correct, DynamicMap callbacks return the whole element each time which will then be translated into an update in the plot. You can of course store the data in one data structure which you keep updating as long as you wrap it in a new Graph.
philippjfr
on 12 Jun 2018
That could probably be made to work but note that #768 has very little to do with it. #768 will add the ability to map column values to arbitrary properties on the glyph, but it will not let you switch between glyphs. Since the unicode example uses a completely different glyph (the text glyph) that is not simply some variation on the marker property that PR will not allow you to switch between them arbitrarily without a lot of special handling. Edit: I suppose #768 is general and does cover that, it's just that the current PR won't handle that and if we want that behavior it will need special handling.
Ok. I do think that behavior would be useful; cycling through glyphs is not an uncommon thing to want to do...
jbednar
on 14 Jun 2018
cycling through glyphs is not an uncommon thing to want to do...
Cycling through glyphs it's not a good idea as it'll be pretty inefficient, we can map column values to markers or to display them directly as unicode text but I don't see how it'll be possible to support both at once in any reasonable way.
philippjfr
on 14 Jun 2018
I'm probably misusing some technical terms there, but I'm just saying that a given plot will want to use different shapes for different data points, based on the value of some other value dimension.
jbednar
on 14 Jun 2018
Repurposed this issue to add an example demonstrating this in the docs.
philippjfr
on 14 Jun 2018
Putting this in the docs sounds great!
FYI, I tried running the first code example in a jupyter notebook but I couldn't get the graph to display and update (I could gt the graph to display but when I did the loop with the streams nothing happened).
CJ-Wright
on 14 Jun 2018
That's odd, just to confirm, which versions of HoloViews and Bokeh do you have?
philippjfr
on 14 Jun 2018
(dp_dev) christopher@christopher-ubuntu ~ $ conda list holoviews
# packages in environment at /home/christopher/mc/envs/dp_dev:
#
# Name                    Version                   Build  Channel
holoviews                 1.10.4                     py_0    conda-forge
(dp_dev) christopher@christopher-ubuntu ~ $ conda list bokeh
# packages in environment at /home/christopher/mc/envs/dp_dev:
#
# Name                    Version                   Build  Channel
bokeh                     0.12.16                  py35_0    conda-forge
Can't think of any change that would make a difference but maybe try updating to 1.10.5.
philippjfr
on 14 Jun 2018
Related issues
 lrdsouza
·
3Comments
lrdsouza
·
3Comments
 Forander
·
6Comments
Forander
·
6Comments
 jlstevens
·
6Comments
jlstevens
·
6Comments
 hojo0590
·
4Comments
hojo0590
·
4Comments
 cristi-neagu
·
5Comments
cristi-neagu
·
5Comments