Holoviews: Support datetime formatting in bokeh hover tools
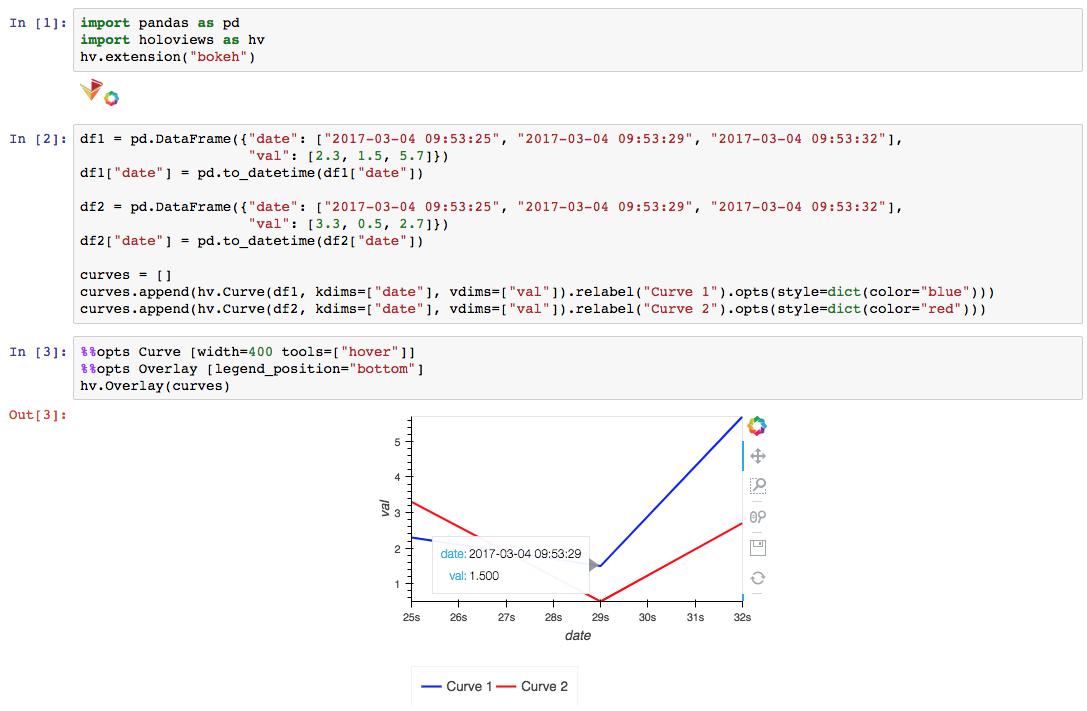
Here is what I have right now (installed all the packages for Python 3.6.1 a minute ago):

Please note that axis is rendered properly - it's just a hover tool who is missing the right rendering.
P.S. It's pretty typical last mile issue with holoviews: when you get your plot defined properly up to 95% but the last 5% makes you drop it and move to native bokeh, matplotlib struggling.
Thanks in Advance!
 thoth291
All 22 comments
I've now handled this correctly in #1263. That said there are various mechanisms to get around "last mile" issues, the simplest of which is to use finalize_hooks to modify the plot objects directly, e.g. to address this issue something like this would work:
def fix_hover_date(plot, element):
    if 'hover' not in plot.handles:
        return
    xdim = element.kdims[0]
    hover = plot.handles['hover']
    source = plot.handles['source']
    hover.tooltips[0] = ('x', '@{x_dt}')
    source.data['x_dt'] = [xdim.pprint_value(v) for v in source.data['x']]

%%opts Curve [tools=['hover'] finalize_hooks=[fix_hover_date]]
hv.Curve((list(pd.date_range('2016-01-01', '2016-01-31')), range(31)))
 philippjfr
on 10 Apr 2017
philippjfr
on 10 Apr 2017
This has now been merged.
philippjfr
on 10 Apr 2017
I'm still having this issue.
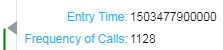
Here's the dtypes result:
Entry Time            datetime64[ns]
Frequency of Calls             int64
dtype: object
Package versions:
bokeh=0.12.14=py36_0
holoviews=1.9.4=py36_0
 bacalfa
on 14 Mar 2018
bacalfa
on 14 Mar 2018
This is weird... a small example worked fine:
I have to figure out what's happening in the other case. Unfortunately, I can't share it. Any guesses?
bacalfa
on 15 Mar 2018
It seems it has to do with changing column/dimension names (?). Here's what's happening.
The following doesn't work as expected (dates aren't formatted properly in hover tool text):
df_resample= {}
df_resample_curves = []
for d in dlist:
    df_resample[d] = df[d].resample("15T", on="EntryTime").count()["Some Name"].reset_index()
    df_resample[d].columns = ["Entry Time", "Frequency of Calls"]
    df_resample_curves.append(hv.Curve(df_resample[d], kdims=["Entry Time"], vdims=["Frequency of Calls"]).relabel(d))
%%opts Overlay [legend_position="top"]
%%opts Curve [width=700 height=500 tools=["hover"]]
hv.Overlay(df_resample_curves)


md5-c2c8e3c2991fb62dc087aad133cd40b2


df_resample= {}
df_resample_curves = []
for d in dlist:
    df_resample[d] = df[d].resample("15T", on="EntryTime").count()["Some Name"].reset_index()
    df_resample_curves.append(hv.Curve(df_resample[d], kdims=["EntryTime"], vdims=["Some Name"]).relabel(d))


md5-d5a698607a6058a9a36f6aeab26bdf5e


%%opts Overlay [legend_position="top"]
%%opts Curve [width=700 height=500 tools=["hover"]]
hv.Overlay(df_resample_curves)
Even if I do .redim(EntryTime="Entry Time"), it also messes up the date formatting. So something is going on when changing the name of the date dimension.
bacalfa
on 15 Mar 2018
Thanks for investigating that's very helpful! I think I have a good idea what it might be now.
philippjfr
on 15 Mar 2018
@philippjfr, I'm hitting this same problem:
Here's the reproducible notebook that displays the problem just in case another example is useful.
 rsignell-usgs
on 26 Oct 2018
rsignell-usgs
on 26 Oct 2018
That's definitely useful, thanks!
philippjfr
on 26 Oct 2018
Was this issue ever resolved? I am still having DateTime Hovertool problems
 AnnaBernbaum
on 6 Jan 2019
AnnaBernbaum
on 6 Jan 2019
It's really hard to get a handle on what is still broken because none of the bug reports here include a reproducible example. I'll try to take a look but I'm not convinced I'll cover all the cases, so if you want your particular use case addressed please remember to add a bit of code that will let me reproduce the issue.
(@rsignell-usgs your example was very helpful, I've got a fix for that case now)
philippjfr
on 23 Feb 2019
The Raster/Image case is now handled, I can't currently reproduce any other issues. I'll reassign to 1.12 and if no new issues are reported by then I'll close due to non-reproducibility.
philippjfr
on 23 Feb 2019
I'm experiencing the same problem. A quick workaround seems to be redefinition of the tooltips:
tt = [
        ("date", "@date_column{%F}")
    ]
does not render the output correctly, but using
tt = [
        ("date", "@{date_column}")
    ]
will. That is because there seems to be an internal mechanism which produces an additonal column of the date string in the source and overwrites the tooltip (see holoviews.plotting.bokeh.element._postprocess_hover).
However, the main problem remains: Why does {%F} not produce the correct output?
 BenPortner
on 6 Aug 2019
BenPortner
on 6 Aug 2019
Okay I figured out why {%F} does not work at least in my case. I am using geoviews. In one of its functions the formatters are overwritten (_postprocess_hover function of geoviews.plotting.bokeh.plot module) If I remove the last line of the function, it works for me:
# hover.formatters = formatters
BenPortner
on 6 Aug 2019
Thanks for finding the {%F} thing, I wasn't aware of it. Should be an easy thing to add now.
philippjfr
on 6 Aug 2019
Apart from the {%F} there is a whole range of other formatters for numbers and dates in bokeh. See
https://bokeh.pydata.org/en/latest/docs/reference/models/formatters.html
I would be neat to find a flexible fix to make holoview support all of them!
BenPortner
on 6 Aug 2019
I have problems with geoviews and timestamp tooltips, too. I built a dynamic panel with DynamicPlots based on gv.Points. The day is selectable in the date picker. Initially everything is fine and the hover tool shows formatted datetime. However if select another day with the date picker tool, then all datetime columns are shown in the hover tool as unix timestamps.
 anderl80
on 3 Sep 2019
anderl80
on 3 Sep 2019
It is still very difficult for me to reproduce problems here with reproducible examples.
philippjfr
on 5 Mar 2020
It is still very difficult for me to reproduce problems here with reproducible examples.
@philippjfr
Here is a minimum working example that reproduces the problem (in geoviews):
import geoviews as gv
import pandas as pd
from bokeh.models import HoverTool

d = dict(
    id=["A", "B", "C"],
    long=[-10, 0, 10],
    lat=[0, 0, 0],
    date=["2010-01-01", "2011-01-02", "2012-01-03"]
)
source = pd.DataFrame(d)
source["date"] = pd.to_datetime(source["date"])

gv.extension('bokeh')
tiles = gv.tile_sources.Wikipedia
points = gv.Points(source, ['long', 'lat'], ['id', 'date'])
fig = (tiles * points.opts(tools=[HoverTool(tooltips=[('date', '@date{F}')])]))
gv.renderer('bokeh').save(fig, "geoviews_min")
Expected output:
Three points along the equator. On hover, the date field should show dates in the format "YYYY-MM-DD".
Output right now:
Points are positioned correctly but hover field shows random integer values.
BenPortner
on 11 Mar 2020
Thank you, much appreciated!
philippjfr
on 11 Mar 2020
@BenPortner That is not a HoloViews issue, the correct definition for date formatting would be:
fig = (tiles * points.opts(tools=[HoverTool(tooltips=[('date', '@{date}{%F}')], formatters={'@{date}': 'datetime'})]))
@philippjfr
Sorry, the issue is not resolved for me.
My example with your correction does not work with Holoviews 1.12.7. The output is now a random percentage number. When updating to holoviews 1.13.0 (latest conda-forge build), the example does not run at all and throws an error:
Traceback (most recent call last):
File "C:Usersuserprogramsminicondaenvsgeolibcontextlib.py", line 99, in __exit__
self.gen.throw(type, value, traceback)
File "C:Usersuserprogramsminicondaenvsgeolibsite-packagespanelconfig.py", line 127, in set
yield
File "C:Usersuserprogramsminicondaenvsgeolibsite-packagespaneliosave.py", line 94, in save
model = panel.get_root(doc, comm)
File "C:Usersuserprogramsminicondaenvsgeolibsite-packagespanelviewable.py", line 528, in get_root
root = self._get_model(doc, comm=comm)
File "C:Usersuserprogramsminicondaenvsgeolibsite-packagespanellayout.py", line 136, in _get_model
objects = self._get_objects(model, [], doc, root, comm)
File "C:Usersuserprogramsminicondaenvsgeolibsite-packagespanellayout.py", line 126, in _get_objects
child = pane._get_model(doc, root, model, comm)
File "C:Usersuserprogramsminicondaenvsgeolibsite-packagespanelpaneholoviews.py", line 227, in _get_model
plot = self._render(doc, comm, root)
File "C:Usersuserprogramsminicondaenvsgeolibsite-packagespanelpaneholoviews.py", line 286, in _render
return renderer.get_plot(self.object, *kwargs)
File "C:Usersuserprogramsminicondaenvsgeolibsite-packagesholoviewsplottingbokehrenderer.py", line 73, in get_plot
plot = super(BokehRenderer, self_or_cls).get_plot(obj, doc, renderer, *kwargs)
File "C:Usersuserprogramsminicondaenvsgeolibsite-packagesholoviewsplottingrenderer.py", line 219, in get_plot
*plot_opts)
File "C:Usersuserprogramsminicondaenvsgeolibsite-packagesgeoviewsplottingbokehplot.py", line 181, in __init__
super(GeoOverlayPlot, self).__init__(element, *params)
File "C:Usersuserprogramsminicondaenvsgeolibsite-packagesgeoviewsplottingbokehplot.py", line 63, in __init__
super(GeoPlot, self).__init__(element, **params)
File "C:Usersuserprogramsminicondaenvsgeolibsite-packagesholoviewsplottingplot.py", line 1451, in __init__
params['projection'] = self._get_projection(overlay)
File "C:Usersuserprogramsminicondaenvsgeolibsite-packagesgeoviewsplottingplot.py", line 36, in _get_projection
from_overlay = not all(p is None for p in opts[True]['projection'])
KeyError: 'projection'
BenPortner
on 24 Mar 2020
I have to release a new version of GeoViews before that combination will work.
philippjfr
on 24 Mar 2020
Related issues
 hojo0590
·
4Comments
hojo0590
·
4Comments
 ahuang11
·
3Comments
ahuang11
·
3Comments
 cristi-neagu
·
5Comments
cristi-neagu
·
5Comments
 lrdsouza
·
3Comments
lrdsouza
·
3Comments
 ericmjl
·
3Comments
ericmjl
·
3Comments
Most helpful comment
@BenPortner That is not a HoloViews issue, the correct definition for date formatting would be: