Hikaricp: Is hikari supports database failover automation?
Environment
HikariCP version: 2.7.2
JDK version     : 1.8.0_20
Database        : MSSQL
Driver version  : sqljdbc4(4.0)

        HikariDataSource ds = new HikariDataSource();
        ds.setDriverClassName("com.microsoft.sqlserver.jdbc.SQLServerDriver");
        ds.setMaximumPoolSize(70);
        ds.setMinimumIdle(10);
        ds.setAutoCommit(false);
        ds.setPoolName("HikariEmailDataSource-" + Math.random());

web-server spec : 8EA
CPU(4/8 Core) : 12 Core
Memory(4/8/16 GB) : 4GB

db-server spec 2EA(active, passive)
CPU(4/8 Core) : 20 Core
Memory(4/8/16 GB) : 64GB
msssql 2016
Hi. I'm applying this library to spring-boot application, and some problem has been occur.
we're testing some situation which is database(mssql) fail-over scenario.
mssql db server has applied alwayson(failover method)
scenario step likes below.
- put traffic into the spring-boot application
- database server has been stopped(service block situation)
- hikari dbcp emit exception to application
- database server fail-back complete
- we hope hikari dbcp overcome block situation and back to the normal status
but, hikari doesn't back to the normal status
just exception occur constantly.
Cause: com.microsoft.sqlserver.jdbc.SQLServerException: The connection is closed.
; uncategorized SQLException for SQL []; SQL state [null]; error code [0]; The connection is closed.; nested exception is com.microsoft.sqlserver.jdbc.SQLServerException: The connection is closed.
on the other hands, other dbcp(tomcat, c3p0) has overcome this situation and come back normally.
so, i was wonder about this issue.
Q. hikari supports fail-over recover situation?
(I hope when connection has closed, that might be deleted and get a new connection
but hikari doesn't looks like)
I've already see this issue, but how can I fail-over automation when using spring-boot app?
It looks like handle connection by manually or JMX.
https://github.com/brettwooldridge/HikariCP/issues/181
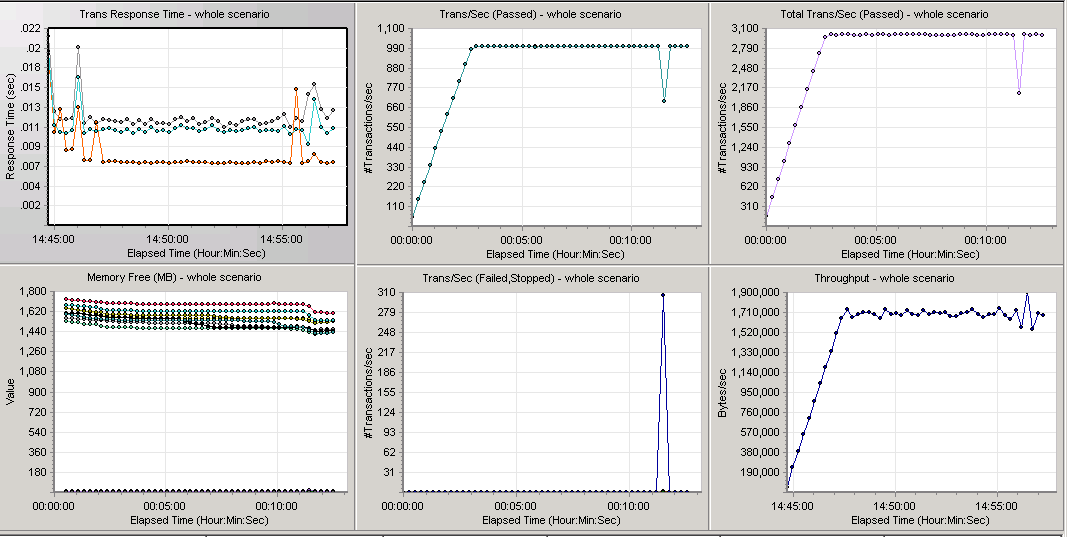
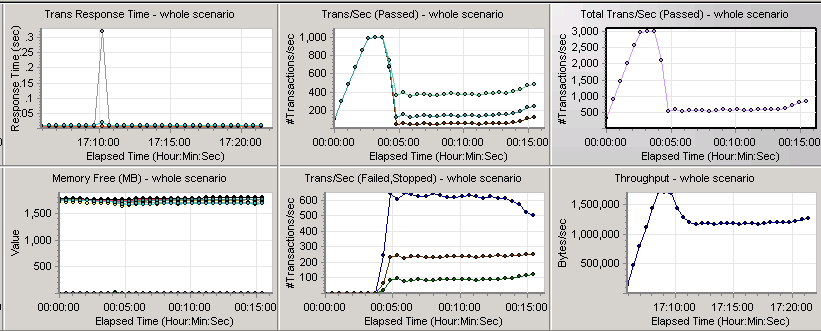
hp load-runner graph attached
picture1. It's tomcat dbcp when put traffic into spring-boot applications, and fail-over situation occur near by 10 mins(transaction point dropped and recovered)
picture2. It's hikari. fail-over situation occur near by 5mins
you guys can see the transaction doesn't recover.
 Gompangs
All 9 comments
Can you provide a full(er) stacktrace?
 brettwooldridge
on 25 Jan 2018
brettwooldridge
on 25 Jan 2018
Sorry, the log file has been deleted by shell script(when we running performance test, automatically remove log with certain period)
Is it must provided to solve this problem?
It takes time to re-appearance those situation.
Gompangs
on 26 Jan 2018
The problem is that I do not know at what point that exception is seen. If it occurs when HikariCP tests the Connection, it should surely eject the Connection from the pool.
However, if that exception occurs from within application code, HikariCP will not detect the issue, and therefore not eject the Connection. Why?
HikariCP recognizes a set of SQL codes that indicate connection failure. For example, all SQL error codes starting with “08” indicate a connection error.
The problem with the exception above is that the driver is throwing a SQLException whose message text indicates a connection failure, but the SQL state is null, and the SQL code is 0. This is clearly outside of both the SQL92 and JDBC specifications.
I suggest that you try the latest MSSQL driver first, before I dig any deeper.
brettwooldridge
on 26 Jan 2018
OK. Thanks
I'll check out things which you've mentioned answer.
And, I'll replying this issue If I test again those issue.
It seems to be solved now when we applying tomcat dbcp without change version of mssql driver.
Gompangs
on 29 Jan 2018
I've encountered a similar situation with a Postgres failover setup behind a virtual IP. The pool continues to throw connection timeouts even after the failover is complete until the application is restarted (which could very well suggest that it's something out of HikariCP's control). I'll have to try to reproduce the behavior in a controlled environment.
org.jooq.exception.DataAccessException: Error getting connection from data source HikariDataSource (hikari_quipdb)
    at org.jooq_3.10.2.POSTGRES_9_4.debug(Unknown Source)
    at org.jooq.impl.DataSourceConnectionProvider.acquire(DataSourceConnectionProvider.java:83)
    at org.jooq.impl.DefaultExecuteContext.connection(DefaultExecuteContext.java:608)
    at org.jooq.impl.AbstractQuery.execute(AbstractQuery.java:311)
    at org.jooq.impl.AbstractResultQuery.fetchLazy(AbstractResultQuery.java:377)
    at org.jooq.impl.AbstractResultQuery.fetchLazy(AbstractResultQuery.java:364)
    at org.jooq.impl.AbstractResultQuery.fetchAny(AbstractResultQuery.java:810)
    at org.jooq.impl.AbstractResultQuery.fetchAny(AbstractResultQuery.java:746)
    at org.jooq.impl.SelectImpl.fetchAny(SelectImpl.java:2979)
    ...
Caused by: java.sql.SQLTransientConnectionException: hikari_quipdb - Connection is not available, request timed out after 120000ms.
    at com.zaxxer.hikari.pool.HikariPool.createTimeoutException(HikariPool.java:666)
    at com.zaxxer.hikari.pool.HikariPool.getConnection(HikariPool.java:182)
    at com.zaxxer.hikari.pool.HikariPool.getConnection(HikariPool.java:147)
    at com.zaxxer.hikari.HikariDataSource.getConnection(HikariDataSource.java:112)
    at org.jooq.impl.DataSourceConnectionProvider.acquire(DataSourceConnectionProvider.java:80)
    ... 26 common frames omitted
 cotej
on 12 Feb 2018
cotej
on 12 Feb 2018
@cotej You are likely running into JVM DNS caching behavior. You need to set:
java.security.Security.setProperty("networkaddress.cache.ttl" , "60");
This sets the DNS cache TTL (Time-to-Live) to 60 seconds.
And set:
java.security.Security.setProperty("networkaddress.cache.negative.ttl", "0");
This tells the JVM not to cache "negative lookups", i.e. don't cache DNS lookup failures.
You may also need to determine what the caching policy is for the upstream DNS server that is used for lookups.
brettwooldridge
on 12 Feb 2018
Ah, yeah it definitely seemed like some sort of JVM-level caching going on. Thanks for the tips @brettwooldridge , I will have a look at those settings.
cotej
on 12 Feb 2018
@cotej did DNS caching configuration tweaking fix the issue ?
Or was the root cause something else.
Facing similar issue with postgres rds failover
 shivsevak
on 24 Jul 2018
shivsevak
on 24 Jul 2018
@shivsevak Yes, in my case setting a non-zero value for networkaddress.cache.ttl in my app server's java.security file was enough to resolve the issue... best of luck!
cotej
on 24 Jul 2018
Related issues
 acehead
·
5Comments
acehead
·
5Comments
 adriandegenhardt
·
4Comments
adriandegenhardt
·
4Comments
 KaoruDev
·
4Comments
KaoruDev
·
4Comments
 hsnamed
·
3Comments
hsnamed
·
3Comments
 baumeister
·
3Comments
baumeister
·
3Comments
Most helpful comment
@shivsevak Yes, in my case setting a non-zero value for
networkaddress.cache.ttlin my app server'sjava.securityfile was enough to resolve the issue... best of luck!