Highcharts: Column type navigator
Example: http://jsfiddle.net/KeGjx/4/
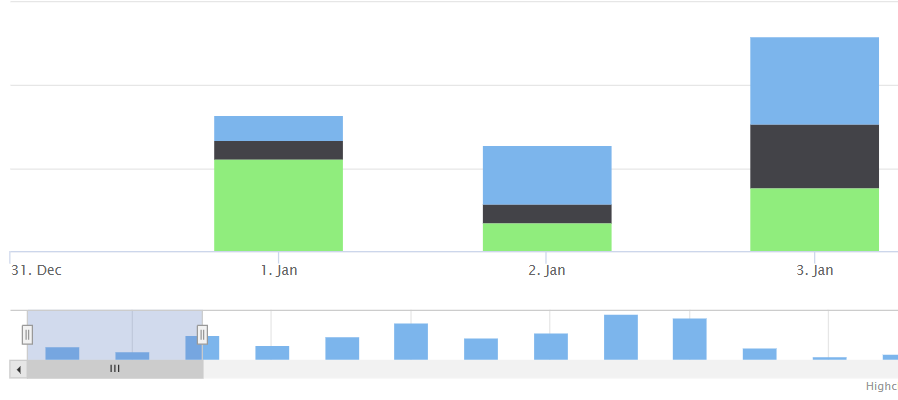
When using columns in navigator, they will be drawn outside navigator. Should be cut or takes less space, I think.
 pawelfus
All 32 comments
Using master: http://jsfiddle.net/highcharts/KeGjx/5/
The navigator series' clip rectangle should be the same as the shaded area.
 TorsteinHonsi
on 14 Aug 2012
TorsteinHonsi
on 14 Aug 2012
Still valid in Highstock 1.3.2
TorsteinHonsi
on 21 Jun 2013
Hi Folks,
Do we have a deadline on this. Check this fiddle out - http://jsfiddle.net/3R9Jx/3/
We can see columns out of alignment (more when fewer in number). This is something very crucial for our product. Just wanted to check if it is under consideration ? If not, can you please suggest some workaround/hack to get this right temporarily.
 CWDev
on 26 May 2014
CWDev
on 26 May 2014
The initial issue is fixed in Highstock 2.
- Highstock 2: http://jsfiddle.net/highcharts/KeGjx/8/
- Highstock 1.3: http://jsfiddle.net/highcharts/KeGjx/9/
TorsteinHonsi
on 27 May 2014
In this
http://jsfiddle.net/highcharts/KeGjx/8/
If you select all of the columns in navigator .. you can see columns in two
charts are misaligned. And in the bottom one, first and last columns look
like trimmer (lesser width)
Looks much better in 1.3, but far from how it should be.
- Half of the first and last column can never be selected by drawing
brush (out of reach) - Things get further weird if you try disabling the scrollbar.
On Tue, May 27, 2014 at 3:47 PM, highslide-software <
[email protected]> wrote:
The initial issue is fixed in Highstock 2.
- Highstock 2: http://jsfiddle.net/highcharts/KeGjx/8/
- Highstock 1.3: http://jsfiddle.net/highcharts/KeGjx/9/
—
Reply to this email directly or view it on GitHubhttps://github.com/highslide-software/highcharts.com/issues/1172#issuecomment-44257586
.
CWDev
on 27 May 2014
Any updates on this ? We are eagerly waiting for this to be fixed. Please let me us know if there are any plans to get this right ?
CWDev
on 2 Jun 2014
Reuploading the issue:
http://jsfiddle.net/d_paul/he16kk2a/3/
 PaulDalek
on 5 Aug 2016
PaulDalek
on 5 Aug 2016
Any updates on this?
 adrianabreu
on 18 Jan 2018
adrianabreu
on 18 Jan 2018
Workaround:
We can disable navigator.series.pointRange (by setting navigator.series.pointRange = null) for navigator series:
- http://jsfiddle.net/BlackLabel/he16kk2a/6/
- http://jsfiddle.net/BlackLabel/KeGjx/10/
- http://jsfiddle.net/BlackLabel/3R9Jx/5/
We are open for suggestions how navigator should behave when we have extra padding outside the columns.
pawelfus
on 18 Jan 2018
hi @pawelfus, first of all, thank you for your answer.
In one of your examples there is an extra category named as 31 Dec (which appears or dissappears depending on the zoom level).
http://jsfiddle.net/BlackLabel/he16kk2a/6/
I'm trying to deal with that situation right now, but even if I play with the startOnTick and endOnTick properties I'm unable to remove that extra category.
Any hint on that?
adrianabreu
on 24 Jan 2018
We can remove that extra ticks with tickPositioner, for example: http://jsfiddle.net/BlackLabel/he16kk2a/7/ (or faster solution for irregular datasets: http://jsfiddle.net/BlackLabel/he16kk2a/8/ )
pawelfus
on 24 Jan 2018
Hello,
Is this issue resolved?
I am experiencing it in Highstock 6.1.0:
https://jsfiddle.net/z3f9xs4m/
As can be seen in the above fiddle, the last set of columns is cut in the navigator.
Thank you.
 mynameiswhat1
on 20 Sep 2019
mynameiswhat1
on 20 Sep 2019
@mynameiswhat1
The issue is still open and the bug is not yet resolved.
Please try with the suggested workaround and if you want to check if the problem was resolved in a newer version you could try with the current code version (right now it's 7.2.0, and the problem is not resolved, but this is a general suggestion).
In case you require help from technical support please contact them using one of the available technical support channels: https://www.highcharts.com/blog/support/
 KacperMadej
on 20 Sep 2019
KacperMadej
on 20 Sep 2019
@KacperMadej thank you for your answer. The problem with the suggested workaround is that the navigator does not start on it's extremes as in the following fiddle: https://jsfiddle.net/mcuw4x0L/ Also, when we move the navigator so it does not include a data point, this data point is still visible in the chart.
Do you have a planned date for the fixing of this bug?
Thank you
mynameiswhat1
on 20 Sep 2019
You are not using the workaround in the shared demo, so it is not expected for the workaround to work.
Also, when we move the navigator so it does not include a data point,
Your options cause this as you have disabled dataGrouping. In case there are other differences please check the code and chart options and compare it with the working demo.
There is no ETA for the fix at this moment.
KacperMadej
on 23 Sep 2019
Workaround:
We can disablenavigator.series.pointRange(by settingnavigator.series.pointRange = null) for navigator series:
Hello, @KacperMadej , what do you mean I am not using the workaroud? I am setting the navigator.series.pointRange to null, as mentioned above. Is this not the workaround?
mynameiswhat1
on 23 Sep 2019
I apologize for the confusion. I was looking at the later comment with tickPositioner modifications.
In that case, the problem you have described is still visible.
You could render the navigator in chart's load to keep the mask and handles at full navigator width:
        load: function () {
        var chart = this,
            navigator = chart.navigator;

        navigator.hasDragged = true; // avoid animation
        navigator.render(0, 0, 0, chart.plotWidth);
        navigator.hasDragged = false; // clean up
      }
Hello @KacperMadej , no problem and thank you for your answer. What about the other issue I described above:
Also, when we move the navigator so it does not include a data point, this data point is still visible in the chart.
as visible in the following image:

Is this related or is it a different issue?
Thank you.
mynameiswhat1
on 24 Sep 2019
Hi @mynameiswhat1
Regarding this part:
Do you have a planned date for the fixing of this bug?
There's no ETA for this ticket. We could improve this if only someone would explain what is the expected behaviour, see my request above:
We are open for suggestions how navigator should behave when we have extra padding outside the columns.
I assume that this is the behaviour you expect: https://jsfiddle.net/BlackLabel/024y9rqu/ - so no action when right handle is between tick = 13:00 and right edge of the navigator. Also position of the handle respects pointRange so zooming in the middle of a bar will show part of this bar only. Could you confirm? Or perhaps you have some other suggestions to improve these columns in navigator? If you do, please share them :)
pawelfus
on 24 Sep 2019
Hello @pawelfus,
Regarding the following
There's no ETA for this ticket. We could improve this if only someone would explain what is the expected behaviour, see my request above:
We are open for suggestions how navigator should behave when we have extra padding outside the columns.
I can only give my opinion, which is that the navigator should mimic the chart above it and vice-versa.
Regarding the fiddle you have shared (https://jsfiddle.net/BlackLabel/024y9rqu/), it is my opinion that it is showing the correct behaviour, except for the fact there is no action when right handle is between tick = 13:00 and right edge of the navigator and between tick= 11:30 and left edge of the navigator. I belive the navigator action must be reflected in the chart and be consistent for the entire navigator.
Thank you.
mynameiswhat1
on 24 Sep 2019
Ok, makes sense and feels natural, take a look: https://jsfiddle.net/BlackLabel/b0ramd68/ - thanks for helping us! We really appreciate this :) Let us know if you find any issues with the given solution, hopefully this/next week I should be able to fix this issue.
pawelfus
on 25 Sep 2019
Hello @pawelfus, thank you for your quick reply. The proposed solution seems to work great for a small data set, however, if the number of data points increases, the issue becomes again evident, as can be seen in the following image taken from the bellow fiddle, where there are 3 columns in the chart and 5 between the navigator handles:

https://jsfiddle.net/xhjpka4y/
If more series are added, the problem is also evident, at least with many data points.
Also, is it possible that this solution has some impact on performance, somehow, or you believe that this will not be an issue?
Once again, thank you.
mynameiswhat1
on 25 Sep 2019
Thanks! The current solution does not decrease performance.
The issue you described above is actually a feature to improve performance. You can increase cropThreshold to see missing points: https://jsfiddle.net/BlackLabel/kquzb1jp/4/ - but this will affect performance.
I can suggest a workaround to modify internal property that takes care of a number of cropped data points:
H.seriesTypes.column.prototype.cropShoulder = 1;
Demo: https://jsfiddle.net/BlackLabel/kquzb1jp/6/ - that won't affect much performance (just extra 2 * number_of_series points).
pawelfus
on 25 Sep 2019
Hello @pawelfus ,
Regarding fiddle https://jsfiddle.net/BlackLabel/kquzb1jp/4/ a issue is still there as in the following image:

but since it will decrease performance it is also not a solution for us.
Regarding fiddle https://jsfiddle.net/BlackLabel/kquzb1jp/6/ it seems to work fine, at least for the immediate testing I have performed. I will let you know if I find any issue.
I have a question though, you've said that we need to set
H.seriesTypes.column.prototype.cropShoulder = 1;
however, in the fiddle it is
H.seriesTypes.column.prototype.cropShoulder = 2;
Do I need to set different values for cropShoulder for different number of data points or series? If not, which one is correct, value 1 or 2?
Also, if I want this to work for bar as well for column type charts I am assuming that I need to set it for both types, as such:
(function(H) {
H.seriesTypes.column.prototype.cropShoulder = 2;
H.seriesTypes.bar.prototype.cropShoulder = 2;
  H.wrap(
    H.Axis.prototype,
    'toFixedRange',
    function(p, pxMin, pxMax, fixedMin, fixedMax) {
      var ret = p.apply(this, Array.prototype.slice.call(arguments, 1));
      if (H.defined(this.pointRange)) {
        if (!fixedMin) {
          ret.min += this.pointRange / 2;
        }
        if (!fixedMax) {
          ret.max -= this.pointRange / 2;
        }
      }
      return ret;
    }
  )
})(Highcharts);
Is my assumption correct?
Thank you
mynameiswhat1
on 25 Sep 2019
Do I need to set different values for cropShoulder for different number of data points or series? If not, which one is correct, value 1 or 2?
There should be 1. It's a number of additional points that are rendered outside the extremes - from your demos it seems that always one point on the left and one on the right is missing, so one extra point is needed only. Sorry for the confusion!
Also, if I want this to work for bar as well for column type charts I am assuming that I need to set it for both types, (...)
Yes, that's correct
pawelfus
on 25 Sep 2019
No problem @pawelfus.
Unfortunatelly, for many series, using the provided workaround, it seems there are issues:


Also, in the original fiddle, the same issue exists:


Thank you.
mynameiswhat1
on 26 Sep 2019
Thanks for pointing this out! It seems to be something with minRange. Unfortuantely, I don't see an easy way to workaround this without breaking other functionalities.
Internal note:
When trying to zoom exactly at the minRange (or below) we render minRange's width in navigator which is incorrect: should be width of minRange + pointRange. Simplified demo: https://jsfiddle.net/BlackLabel/kquzb1jp/29/ - zoom using left or right handle to the minimum. Navigator shows 5 columns, while main xAxis has 6 points.
So solution is either to increase the mask's width in navigator (+info in docs) or try to decrease the number of points in base xAxis. In xAxis.minRange we have:
The default minRange for the x axis is five times the smallest interval between any of the data points.
Which is not correct for series with pointRange: https://jsfiddle.net/BlackLabel/kquzb1jp/32/ - zoom in a few times and you will see six columns instead of five (line series: https://jsfiddle.net/BlackLabel/kquzb1jp/33/ ) Workaround is to decrease minRange by pointRange: https://jsfiddle.net/BlackLabel/kquzb1jp/40/ but that will create other problems: https://jsfiddle.net/BlackLabel/kquzb1jp/44/ (we can zoom-in even when there are only three points..)
pawelfus
on 26 Sep 2019
Ok, please let me know if a solution is found.
Thank you
mynameiswhat1
on 27 Sep 2019
Hi @mynameiswhat1
I have prepared PoC for the fix, would you like to test it? The solution has one limitation: a user can't zoom below one column (group of columns with the same x) - I will update docs. I think it's small cost to get column type series in the navigator, please check the demos with fix:
- http://jsfiddle.net/BlackLabel/6rzqoasu/1/
- http://jsfiddle.net/BlackLabel/Lmhqngu5/
- http://jsfiddle.net/BlackLabel/yncevr5j/1/
Note:
Fix above does not touch issue with cropShoulder - I suggest to use that workaround until #3136 will be fixed (for example we will introduce an option to configure that).
Once again, thanks for your help! :)
TO DO:
- [x] - tests
- [x] - samples
- [x] - docs update
pawelfus
on 2 Oct 2019
Hello @pawelfus,
Thank you for your effort. Regarding the testing, I've noticed that for your third fiddle: http://jsfiddle.net/BlackLabel/yncevr5j/1/ the navigator is not working as I would expect it, since I can only zoom until the limits I'm showing in the bellow image:

As for the others, at least for the scenarios I've tested, they seem to be working fine.
Thank you.
mynameiswhat1
on 8 Oct 2019
@mynameiswhat1 - in the demo you are referring to minRange is not set. So default minRange is used (closest distance between two points * 5).
pawelfus
on 8 Oct 2019
Sorry, missed that :)
mynameiswhat1
on 8 Oct 2019
Related issues
 ppotaczek
·
3Comments
ppotaczek
·
3Comments
 balupton
·
3Comments
balupton
·
3Comments
 madreason
·
3Comments
madreason
·
3Comments
 Dunge
·
3Comments
Dunge
·
3Comments
 bbonczek
·
3Comments
bbonczek
·
3Comments
Most helpful comment
Reuploading the issue:
http://jsfiddle.net/d_paul/he16kk2a/3/