Highcharts: Series.update breaks adaptToUpdatedData=false for multiple navigator series
Expected behaviour
Series[index].update(options) combined with navigator: { adaptToUpdatedData: false, series: navdata } works the same way for multiple series in navigator as a single series.
Actual behaviour
When doing a dynamic update using series[index].update(options) combined with navigator: { adaptToUpdatedData: false, series: navdata }, all navigation series are updated with data from the main series. So it's not possible to update line color without getting problems with the time range in navigator. As a workaround I'm now recreating the whole chart with the new set option, but this kind of defeats the purpose of the series[index].update(options) function. Am I missing an options here somwhere, or is this a bug? Note that this only happens with multiple series in navigator, array instead of single series object.
Live demo with steps to reproduce
Click the 'Update' button to see the problem reproduced example:
http://jsfiddle.net/3mf5dv56/
Working without multiple series (array) in navigator: http://jsfiddle.net/3mf5dv56/1/
Affected browser(s)
Same behaviour in Chrome and IE
 josteinkjellsen
All 56 comments
In version 4.2.7 works as expected:
http://jsfiddle.net/pvbnw62h/
In current version problem exists:
http://jsfiddle.net/pvbnw62h/1
 stpoa
on 19 Oct 2016
stpoa
on 19 Oct 2016
Hi stpoa, and thank you for the quick response. It "works" in that version because it does not support multiple series in naviation. See here: http://jsfiddle.net/kf2wvos9/ and old version http://jsfiddle.net/kf2wvos9/1/
josteinkjellsen
on 19 Oct 2016
I've stepped though it now and everything seems ok after the update(options, redraw) function has executed. I can see the color change etc, but problem is that the update function has marked navigation data to be deleted.
update: function(options, redraw)
So when render() triggers after the update, it breaks the navigator with the remove inactive ticks loop.
render: function()
....
 // Remove inactive ticks
                each([ticks, minorTicks, alternateBands], function(coll) {
                    var pos,
                        i,
                        forDestruction = [],
                        delay = animation.duration,
                        destroyInactiveItems = function() {
                            i = forDestruction.length;
                            [b]while (i--) {
                                // When resizing rapidly, the same items may be destroyed in different timeouts,
                                // or the may be reactivated
                                if (coll[forDestruction[i]] && !coll[forDestruction[i]].isActive) {
                                    coll[forDestruction[i]].destroy();
                                    delete coll[forDestruction[i]];
                                }
                            }[/b]
                        };
The (partly working) dirty workaround: http://jsfiddle.net/z4b37typ/
josteinkjellsen
on 19 Oct 2016
@oysteinmoseng Hi Øystein, just for curious about the priority of this bug. Do you think it may be fixed in next release? I see there is also an issue with navigator when adding and removing series when we have multiple navigator series and the adaptToUpdateData = false. It's most likely handled similar as the update function.
josteinkjellsen
on 27 Oct 2016
@josteinkjellsen We'll certainly do our best to solve it by the next release. Do you have a demo of the issue with adding/removing series?
 oysteinmoseng
on 27 Oct 2016
oysteinmoseng
on 27 Oct 2016
@oysteinmoseng Sounds good. I will make an example as soon as I find time for it and post it here.
josteinkjellsen
on 27 Oct 2016
@oysteinmoseng Here is and example of the broken navigator after chart.addSeries: http://jsfiddle.net/js6krg1u/. I was mistaken, series.remove does seem to work: http://jsfiddle.net/o7a7uLea/.
josteinkjellsen
on 27 Oct 2016
If you are rewriting the whole navigator stuff, will there be an update included which hides navigator serie if the according "main series" visibility is hidden like that:
serie.visible ? serie.hide() : serie.show();
Or has this to be done manually by finding the correct navigator series with
serie.navigatorSeries._id ??
 Skuriles
on 29 Nov 2016
Skuriles
on 29 Nov 2016
@Skuriles If you want this behavior I suggest using series.navigatorSeries.hide() in the hide event of a series for now. Example: http://jsfiddle.net/qq0dc9ah. It can of course be discussed if this should be the default behavior.
oysteinmoseng
on 29 Nov 2016
@oysteinmoseng thanks, much better approach than dealing with internal properties!!
As you said, think it should be default behaviour, or are there any arguments to keep a navigator series if the according line is hidden. This has only negative effects due to scaling etc. of series, or?
Skuriles
on 29 Nov 2016
@Skuriles We briefly discussed it, and decided to make this default behavior. I'll look at it as part of the rewrite.
oysteinmoseng
on 29 Nov 2016
@oysteinmoseng Hi, any info on when this bug will be fixed?
josteinkjellsen
on 18 Jan 2017
@josteinkjellsen Sorry for the wait, this has been pushed down for too long now. We'll take a look at it next week.
oysteinmoseng
on 19 Jan 2017
@oysteinmoseng No worries, I was just curious :) Will just be great to remove the workaround we put on for both update and add.
josteinkjellsen
on 19 Jan 2017
Hi there @oysteinmoseng,
Any update on the progress of this bug?
Thanks!
 emileindik
on 27 Feb 2017
emileindik
on 27 Feb 2017
@EmileIndik Øystein is out of office this week, he'll answer you next week.
 TorsteinHonsi
on 1 Mar 2017
TorsteinHonsi
on 1 Mar 2017
@EmileIndik We started a rewrite which would fix this bug, but it has not been finished yet. I'll try to have it done in the next two weeks or so.
oysteinmoseng
on 10 Mar 2017
Hi, any status updates on this bug?
josteinkjellsen
on 21 May 2017
@josteinkjellsen Sorry, I thought this was done. Apparently not. Looking into it asap.
oysteinmoseng
on 22 May 2017
Navigator update logic has now been rewritten, and should be much more predictable and stable. Let me know if any edge cases have slipped through the cracks.
oysteinmoseng
on 15 Jun 2017
Great! When will it be realeased to the public? I will test it asap.
josteinkjellsen
on 15 Jun 2017
@josteinkjellsen It should be part of the next release (5.0.13). This will probably be out in the next few weeks.
You can test it now by loading Highstock from github.highcharts.com/hc5-fixes. Example: http://jsfiddle.net/3mf5dv56/7/.
oysteinmoseng
on 16 Jun 2017
@oysteinmoseng Thanks! Works fine now :) I see it also fixed the add trend issue that I reported above in the comments as well: http://jsfiddle.net/js6krg1u/3/.
josteinkjellsen
on 16 Jun 2017
@josteinkjellsen Good! It should fix that, yes, but note that we now draw all ordinary series with showInNavigator (or ID/index corresponding to navigator.baseSeries option), and also draw all series from navigator.series option as long as they have the data option set. So in your example above, there are actually 3 series in the navigator, while you can probably get away with two: http://jsfiddle.net/js6krg1u/4/
oysteinmoseng
on 16 Jun 2017

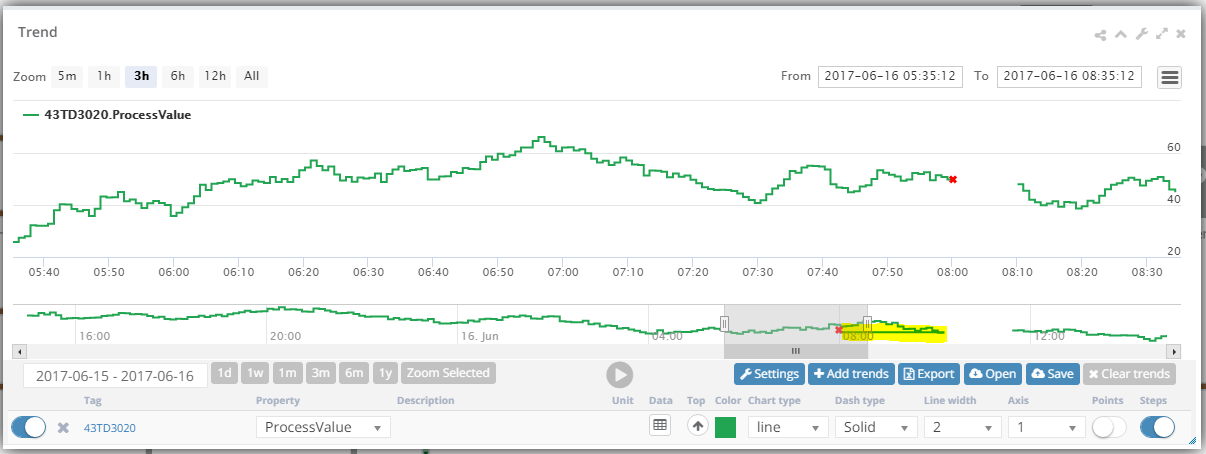
@oysteinmoseng I'm still having some issues with the new update and showInNavigator: true option set. In the picture I've done it double as you can see. Both naviator series is set and the showInNaviagator is true. This just make the issue a bit clearer. Here I've changed from blue to green. After doing series.update() you can see that one of the series kept is data correct, but did not update color (the blue one), while the other got the color, but data is now missing outside the extremes. Any option I've missed?
josteinkjellsen
on 16 Jun 2017
@josteinkjellsen Interesting, are you able to reproduce this in jsFiddle?
oysteinmoseng
on 16 Jun 2017
@oysteinmoseng I will try :)
josteinkjellsen
on 16 Jun 2017
@oysteinmoseng Ok, so it's not quite the same, but similar behaviour here: http://jsfiddle.net/3mf5dv56/8/.
Series.update here only works for main series and not navseries. Series.navigatorSeries.update() does work in jsfiddle, but on my solution there were some changes in navigator data that generates a "Highcharts error #15".
This is the other variant with showInNavigator: false. http://jsfiddle.net/3mf5dv56/9/. Similar result here.
josteinkjellsen
on 16 Jun 2017
@josteinkjellsen But doesn't series.update work as expected in both of those examples? I would not expect the color to change when adaptToUpdatedData is false, but maybe that's debatable? And updating the navigator series directly seems to work for me in your example?
The error #15 is an error indicating that the data is not sorted, which is indicative of some bug for sure. And obviously, looking at your screenshot something is not right. But those jsFiddles seem okay to me?
oysteinmoseng
on 16 Jun 2017
@oysteinmoseng I will try some different variations on my local setup to figure out #15, but I think it's a bit confusing that these three examples don't work the same way:
http://jsfiddle.net/3mf5dv56/7/ <- updates nav
http://jsfiddle.net/3mf5dv56/8/ <- don't update nav
http://jsfiddle.net/3mf5dv56/9/ <- don't update nav
I think for users it's expected that the color will update in the navseries as well, but then again, what if you want to update them seperately.
josteinkjellsen
on 16 Jun 2017
@josteinkjellsen I see what you mean, and this is a bit confusing.
http://jsfiddle.net/3mf5dv56/7/ actually has two navigator series, one based on the non-navigator series (not updated - because of adaptToUpdatedData = false), and one built from navigator.series. This last one is by default drawn with the color of the non-navigator series with the same index, because it does not have its own color set.
http://jsfiddle.net/3mf5dv56/8/ Here we only have one navigator series, based on the non-navigator series, and it's not updated because of the adaptToUpdatedData = false option.
http://jsfiddle.net/3mf5dv56/9/ Here we have one navigator series as well, built from navigator.series - and completely separate from the non-navigator series. Because this one has a color option, it does not draw color automatically from the non-navigator series, and such does not update color. This is basically the same case as in http://jsfiddle.net/3mf5dv56/7/ except there is only one navigator series, and it has a color option.
Hope that made sense.
oysteinmoseng
on 16 Jun 2017
@josteinkjellsen Just a heads-up: I fixed a few minor bugs, one with removing the base series when adaptToUpdatedData = false, and one where there would be an extra navigator series created when navigator.series.data was set and there were base series from the chart present as well.
oysteinmoseng
on 16 Jun 2017
@oysteinmoseng Thanks for clearing that up. I think I found the issue with #15. Seems to happen something after a data gap (null value) in the trend and setData on main series. After update is triggered on the navseries, some data mysteriously appears after the null value. This seems to always "jump" from the null value and backwards in time, causing the #15 error.
Before:

After:
Any data sets availabile with null values available for fiddle?
josteinkjellsen
on 16 Jun 2017
@josteinkjellsen Interesting, try this: http://jsfiddle.net/3mf5dv56/10/
oysteinmoseng
on 16 Jun 2017
@oysteinmoseng Found the issue now. It's not null gaps, but the marker we use. After removing it from my simulator output, it no longer gives me #15 after update. Would however be nice if the series.update would not break when using markers :)
Parts of the simualtor output:
[1497619378555,12.1907252299365],[1497619378585,12.2383128339965],[1497619378615,12.9576282865266],[1497619378645,12.8867367761209],[1497619378675,13.0252956269573],[1497619378705,17.0568942519561],**{"x":1497619378735,"y":17.0568942519561,"marker":{"enabled":true,"symbol":"cross","lineColor": "red"}},**[1497619379035,null],[1497619379065,15.5578962405973],[1497619379095,16.7752762177734],[1497619379125,17.1284956314234],[1497619379155,15.7860076296559],[1497619379185,16.4640452009244],[1497619379215,17.9869569935561],[1497619379245,18.5642694184348],[1497619379275,17.641977035732]...
Cross:
Highcharts.SVGRenderer.prototype.symbols.cross = function (x, y, w, h) {
   return ['M', x, y, 'L', x + w, y + h, 'M', x + w, y, 'L', x, y + h, 'z'];
};
if (Highcharts.VMLRenderer) {
   Highcharts.VMLRenderer.prototype.symbols.cross = Highcharts.SVGRenderer.prototype.symbols.cross;
}
Thanks for all your assistance, have a nice Weekend!
josteinkjellsen
on 16 Jun 2017
@oysteinmoseng Seems the type option is not working: http://jsfiddle.net/3mf5dv56/12/. It is working when doing it this way: http://jsfiddle.net/3mf5dv56/13/, but now I've change my solution to use the first approach.
josteinkjellsen
on 19 Jun 2017
@josteinkjellsen Looking into it
oysteinmoseng
on 19 Jun 2017
@oysteinmoseng You are probably working on this still, would just mention that the version that here: http://github.highcharts.com/hc5-fixes/stock/highstock.js now breaks the fix that was made (http://jsfiddle.net/3mf5dv56/7/). For us changing the type option is not that important, as it almost never is changed in run-time, but I thought I would mention it.
josteinkjellsen
on 21 Jun 2017
@josteinkjellsen Yes, we were having some issues with the github.highcharts.com service, so that link didn't serve the latest code. Should be resolved now.
Still looking into the type-issue, and will also take a look at markers.
oysteinmoseng
on 21 Jun 2017
@oysteinmoseng Hi, I see there has been released a new version that fixes a lot of bugs. Any news on the type option bug (http://jsfiddle.net/3mf5dv56/12/)?
josteinkjellsen
on 31 Jul 2017
Hi Jostein, Øystein is currently out of office, he will reply to you when he's back.
TorsteinHonsi
on 2 Aug 2017
@josteinkjellsen Hi Jostein, I will continue to look into the type issue and other navigator issues as soon as possible.
oysteinmoseng
on 9 Aug 2017
@oysteinmoseng Almost perfect now 👍 One small thing, could the navigator series color follow the main series when first created? Now I set main series green, but it always shows the default blue in navigator.
Example: http://jsfiddle.net/3mf5dv56/16/
josteinkjellsen
on 31 Aug 2017
@josteinkjellsen That seems like a good idea. What do you think @TorsteinHonsi?
Internal note: Currently this does not happen because the default navigator options include a color property. If we remove this we somehow need to pull the color directly from the base series, in case the base series does not have a color defined in options.
oysteinmoseng
on 31 Aug 2017
@josteinkjellsen That seems like a good idea. What do you think @TorsteinHonsi?
Yes, makes sense now that we have multiple navigator series. It will break a lot of auto-visual tests though, but we could do it in the switch to HC6. Have to make sure that the navigator.series.color option is still respected though.
TorsteinHonsi
on 31 Aug 2017
@TorsteinHonsi / @oysteinmoseng It used to work like that in previous version (like 5.0.12), but I guess now series.options and series.navigatorSeries.options is not pointing to the same object. See 5.0.12 version here: http://jsfiddle.net/3mf5dv56/17/
josteinkjellsen
on 31 Aug 2017
Okay, here's something fishy. Apparently, when the navigator.series option is defined as an array, the navigator series' color is inherited from the base series. This also happens in the current v5.0.14: http://jsfiddle.net/highcharts/3mf5dv56/18/. Comment out the line series: [] and the navigator gets blue.
So what we need to find out is why there is a change in behaviour depending on the navigator.series option. It is confusing and seems like a bug. In my opinion we should change it so it always inherits the color from the base series.
TorsteinHonsi
on 1 Sep 2017
@TorsteinHonsi Yes, this should not happen anymore with the latest code (http://jsfiddle.net/3mf5dv56/19/), the way we generate navigator series has been normalized to be more consistent across the possible options.
@josteinkjellsen We decided to look at making the nav series inherit color as we approach HC6, to avoid breaking our tests too soon. For now, you could work around the issue like this: http://jsfiddle.net/3mf5dv56/20/ although you will have to explicitly set a color on each base series for this to work.
oysteinmoseng
on 1 Sep 2017
This is now part of HC6 so closing this issue. This issue is getting a bit long, so let's start a new ticket for any further tweaks on the subject.
oysteinmoseng
on 5 Oct 2017
Hi, have you started a new ticket? Still broken in 6.0.1. http://jsfiddle.net/3mf5dv56/23/
Edit: Strange, See here: http://jsfiddle.net/3mf5dv56/25/ . It works if you click update 1, then breaks when clicking update2. Also the oposite, it works when clicking update2 and breaks when clicking update1 after.
josteinkjellsen
on 18 Oct 2017
@josteinkjellsen No new ticket open, feel free to start one. I'll take a look this week
oysteinmoseng
on 18 Oct 2017
@josteinkjellsen Pushed fix for this, everything should work now as far as I know.
oysteinmoseng
on 23 Oct 2017
@oysteinmoseng Sounds good! Anyway to test it?
josteinkjellsen
on 25 Oct 2017
You can use http://github.highcharts.com/bugfix/highstock.src.js - updated demo: http://jsfiddle.net/3mf5dv56/26/
 pawelfus
on 25 Oct 2017
pawelfus
on 25 Oct 2017
@pawelfus Thanks! Works great now 👍
josteinkjellsen
on 25 Oct 2017
Related issues
oysteinmoseng
·
3Comments
 madreason
·
3Comments
madreason
·
3Comments
 ananth-imagin
·
3Comments
ananth-imagin
·
3Comments
 bbonczek
·
3Comments
bbonczek
·
3Comments
 nagin
·
3Comments
nagin
·
3Comments
Most helpful comment
@EmileIndik We started a rewrite which would fix this bug, but it has not been finished yet. I'll try to have it done in the next two weeks or so.