Helm-charts: add all\custom namespaces to monitoring kube-prometheus-stack
Hi team,
I wasn't able to find how to add all metrics from different namespaces to monitoring. It looks like only metrics in deployment
namespace with kube-system and default were added
All services in custom namespaces were added successfully with additionalServiceMonitors section, but how may i add non services metrics - volumes, ingress etc. I tried this part in values.yaml _## Namespaces to scope the interaction of the Prometheus Operator and the apiserver (allow list)_ but without success.
I found only this workaround https://github.com/prometheus-operator/kube-prometheus#adding-additional-namespaces-to-monitor and found this solution https://github.com/prometheus-operator/prometheus-operator/issues/2890#issuecomment-583006452
but it doesn't help. Should i create role and rolebinding in every necessary namespace or something else?
eks 1.17
prometheus-operator-9.3.0
app version 0.38.1
Thank you in advance.
 symanovich-a
All 15 comments
I think you would want to add something like the following into your helm values. This will allow kube-prometheus-stack to automatically discover PodMonitor, Rule, and ServiceMonitor objects in any namespace.
prometheus:
      prometheusSpec:
        podMonitorNamespaceSelector:
          any: true
        podMonitorSelector: {}
        podMonitorSelectorNilUsesHelmValues: false
        ruleNamespaceSelector:
          any: true
        ruleSelector: {}
        ruleSelectorNilUsesHelmValues: false
        serviceMonitorNamespaceSelector:
          any: true
        serviceMonitorSelector: {}
        serviceMonitorSelectorNilUsesHelmValues: false
 jwenz723
on 29 Sep 2020
jwenz723
on 29 Sep 2020
@jwenz723 thank you for your answer, but as i mentioned previously with this link https://github.com/prometheus-operator/prometheus-operator/issues/2890#issuecomment-583006452 it doesn't help. Persistence volumes don't appear except one - prometheus storage.
symanovich-a
on 5 Oct 2020
The particular settings that I mentioned in my comment above should have no effect on whether or not persistent volumes get created. If you would like persistent volumes to be created then I would recommend that you take a look at this.
jwenz723
on 5 Oct 2020
No, i'm not talkng about creating volume for prometheus. I'm talking about monitoring free space, used size volumes in different namespaces
symanovich-a
on 5 Oct 2020
I am really interested in this, too.
 shibumi
on 3 Nov 2020
shibumi
on 3 Nov 2020
@symanovich-a I had a proper look on this and actually you should be able to have access to all PVs via the kube_persistentvolume_capacity metric for example. PersistentVolumes are not namespaced in Kubernetes, so they all just get the tag "namespace='monitoring'". This confuses on first sight.. but if you look up the PV names you should see volumes from different namespaces.
I just applied the default values.yaml and this definitely works for me.
shibumi
on 3 Nov 2020
Thank you @shibumi. It was my fault, i meant pvc in terms of volume, not pv(persistent volume).
in my case i have aws instances with ebs volumes and local storages(nvme). I see only monitoring ebs pvc and nvme pvc metrics in different, nondefault namespaces.
symanovich-a
on 5 Nov 2020
@symanovich-a what do you want to monitor exactly? A PVC is just a claim for a PV. The current storage usage etc can be found in the PVs. The PVC just defines how much storage should be claimed (either manually or dynamically).
shibumi
on 5 Nov 2020
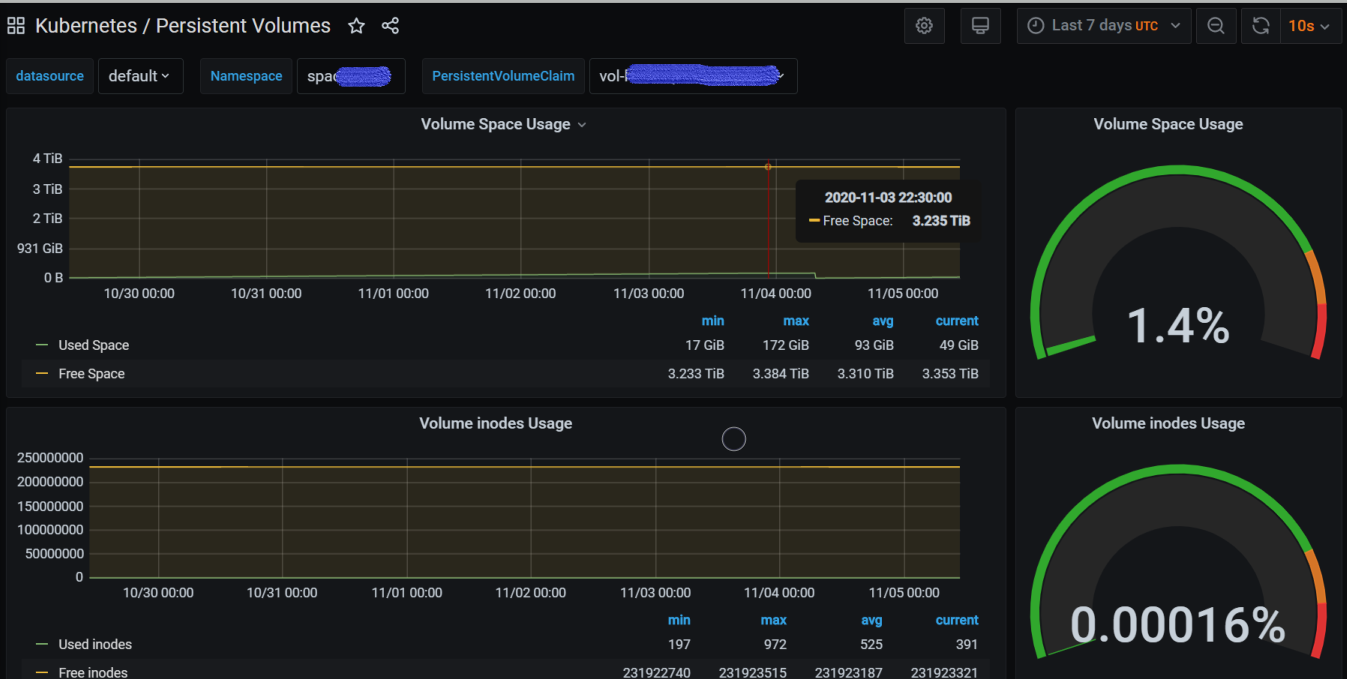
i would like to see metrics kubelet_volume_stats_* for all ebs\nvme volumes
let me share some screenshots to visualize this

symanovich-a
on 5 Nov 2020
@symanovich-a the ebs and nvme volumes are an own storage class?
shibumi
on 6 Nov 2020
prometheus ebs on gp2 and this class is default, some ebs on custom non gp2 class, nvme on they own local-storage class.
symanovich-a
on 6 Nov 2020
@symanovich-a you can reach this via building your own dashboard and specifying the storage class as label (if the metric allows it). Otherwise you need to filter them.
shibumi
on 6 Nov 2020
i can't, because there are no metrics kubelet_volume_stats_* for all pvc\pv
symanovich-a
on 6 Nov 2020
This issue has been automatically marked as stale because it has not had recent activity. It will be closed if no further activity occurs. Any further update will cause the issue/pull request to no longer be considered stale. Thank you for your contributions.
![stale[bot] picture](https://avatars3.githubusercontent.com/in/1724?v=4&s=40) stale[bot]
on 6 Dec 2020
stale[bot]
on 6 Dec 2020
This issue is being automatically closed due to inactivity.
stale[bot]
on 20 Dec 2020
Related issues
 yanhuibin315
·
4Comments
yanhuibin315
·
4Comments
 irizzant
·
9Comments
irizzant
·
9Comments
 stylianosrigas
·
3Comments
shibumi
·
9Comments
stylianosrigas
·
3Comments
shibumi
·
9Comments
 celestialorb
·
8Comments
celestialorb
·
8Comments
Most helpful comment
I think you would want to add something like the following into your helm values. This will allow kube-prometheus-stack to automatically discover PodMonitor, Rule, and ServiceMonitor objects in any namespace.