Current Behavior
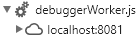
When debugging with Chrome, the debugger does not show the scripts from webpack in the sources tab.
Expected Behavior
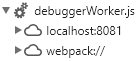
Source files are shown in the sources tab and it is possible to place breakpoints and debug the code, i.e.:
Haul Configuration (webpack.haul.js)
var webpack = require('webpack');

module.exports = ({ platform }, { module, resolve, plugins }) => ({
  entry: `./src/index.${platform}.tsx`,
  module: {
    ...module,
    rules: [
      {
        test: /\.tsx?$/,
        use: [
          'babel-loader',
          'ts-loader'
        ]
      },
      ...module.rules
    ]
  },
  resolve: {
    ...resolve,
    extensions: [
      '.ts',
      '.tsx',
      `.${platform}.ts`,
      '.native.ts',
      `.${platform}.tsx`,
      '.native.tsx',
      ...resolve.extensions
    ]
  },
  plugins: [
    ...plugins,
    new webpack.optimize.ModuleConcatenationPlugin()
  ]
});
| software | version
| ---------------- | -------
| Haul | 1.0.0-beta.4
| react-native | 0.47.1
| node | 7.9.0
| npm or yarn | 5.3.0
Other Information
While attempting to resolve this issue, I found that the file debuggerWorker.js is loading the app file using fetch, replacing 'this["webpackHotUpdate"]' with 'self["webpackHotUpdate"]' and then evaling it.
While this works (as in, the app works), I believe Chrome doesn't understand that the files loaded through fetch should be added as source files.
I tried replacing the line
fetch(message.url).then(resp => resp.text()).then(evalJS);
with
try {
  importScripts(message.url);
} catch (e) {
  self.ErrorUtils.reportFatalError(e);
} finally {
  self.postMessage({ replyID: message.id });
  processEnqueuedMessages();
}
but this just left a blank screen. I had to use the following for it to actually work:
var error;
try {
  importScripts(message.url);
} catch (e) {
  error = e;
}
processEnqueuedMessages();
sendReply(null, error);
 rtomchinsky
All 7 comments
cc @Krizzu
 satya164
on 3 Aug 2017
satya164
on 3 Aug 2017
We can't use importScripts because the stack trace for errors is useless. Replacement of 'this["webpackHotUpdate"]' with 'self["webpackHotUpdate"]' is just for the webpack boostraping logic so that it doesn't throw the error.
 zamotany
on 4 Aug 2017
zamotany
on 4 Aug 2017
Try adding devtool: 'eval-source-map', to webpack.haul.js.
zamotany
on 4 Aug 2017
That works, thanks!
rtomchinsky
on 4 Aug 2017
Try adding devtool: 'eval-source-map', to webpack.haul.js.
Shouldn't this be in the docs?
 Fconstant
on 4 Aug 2017
Fconstant
on 4 Aug 2017
Probably this needs a PR to Haul.
zamotany
on 4 Aug 2017
@zamotany
Try adding devtool: 'eval-source-map', to webpack.haul.js.
添加这个之后,文件是不换行的,由于文件不换行,所以没有办法对文件中的某一行代码设置断点。
我按照source maps这个里面添加了:
webpack.parts.js:
exports.generateSourceMaps = ({ type }) => ({
  devtool: type,
});
webpack.config.js:
const productionConfig = merge([

  parts.generateSourceMaps({ type: 'source-map' }),

  ...
]);

const developmentConfig = merge([

  {
    output: {
      devtoolModuleFilenameTemplate: 'webpack:///[absolute-resource-path]',
    },
  },
  parts.generateSourceMaps({ type: 'cheap-module-eval-source-map' }),

  ...
]);
并且将webpack.haul.js中设置为
module.exports = ({ platform }, defaults) => ({
  entry: `./index.${platform}.js`,
  devtool: 'eval-source-map', // eval-source-map
});
仍然是显示一行,不能对文件中设置断点调试
 springHyc
on 24 Aug 2017
springHyc
on 24 Aug 2017
Related issues
 xareelee
·
5Comments
satya164
·
5Comments
xareelee
·
5Comments
satya164
·
5Comments
 Natteke
·
6Comments
Natteke
·
6Comments
 dave-irvine
·
4Comments
dave-irvine
·
4Comments
 rdy
·
3Comments
rdy
·
3Comments
Most helpful comment
Try adding
devtool: 'eval-source-map',towebpack.haul.js.