Gt: Feature requests: p-values and stacking spanners
I'm already a big fan of this package, but there are a few things that would make it even more useful for the sorts of tables I generate. First off, will it be possible to stack spanners, so that the same column can have two levels of spanners? Secondly, will be possible to have a number format which automatically *'s numbers less than .05, 's numbers less than .01, and *'s numbers less than .001? I've been having trouble getting the base footnotes to work for this, so having a built-in tool would be fantastic.
 thisisnickb
All 5 comments
You should have a look at @vincentarelbundock 's great new gtsummary package. It uses gt and is geared toward statistical model summaries.
It's also possible to make your own formatter for this!
library(gt)
library(broom)
library(tidyverse)

# Create a simple formatter for statistical significance
# (creating stars from p values)
fmt_stars <- function(data,
                      columns,
                      rows = NULL) {

  # Capture expression in `rows`
  rows <- rlang::enquo(rows)

  # Pass `data`, `columns`, `rows`, and the formatting
  # functions as a function list to `fmt()`
  fmt(
    data = data,
    columns = columns,
    rows = !!rows,
    fns = list(
      default = function(x) {

        x_str <-
          dplyr::case_when(
            between(x, 0, 0.005) ~ "***",
            between(x, 0, 0.01) ~ "**",
            between(x, 0, 0.05) ~ "*",
            TRUE ~ "."
          )
      }
    )
  )
}

# Create a linear model with `mtcars`, tidy the
# summary with `broom::tidy()`, add an extra
# `stars` column (with the p values), create
# a gt table, format the p values as stars
lm(mpg ~ wt + qsec, mtcars) %>%
  broom::tidy() %>%
  dplyr::mutate(stars = p.value) %>%
  gt() %>%
  fmt_stars(columns = vars(stars))

As far as the multiple spanners (level 3 and above), that adds a lot of complexity to the API and to the resulting tables. Are there some convincing use cases for going beyond 2 levels of headers?
 rich-iannone
on 20 Feb 2019
rich-iannone
on 20 Feb 2019
@thisisnickb if you end up trying gtsummary and feel that there are missing features, let me know. Happy to expand the scope if people find it useful.
 vincentarelbundock
on 20 Feb 2019
vincentarelbundock
on 20 Feb 2019
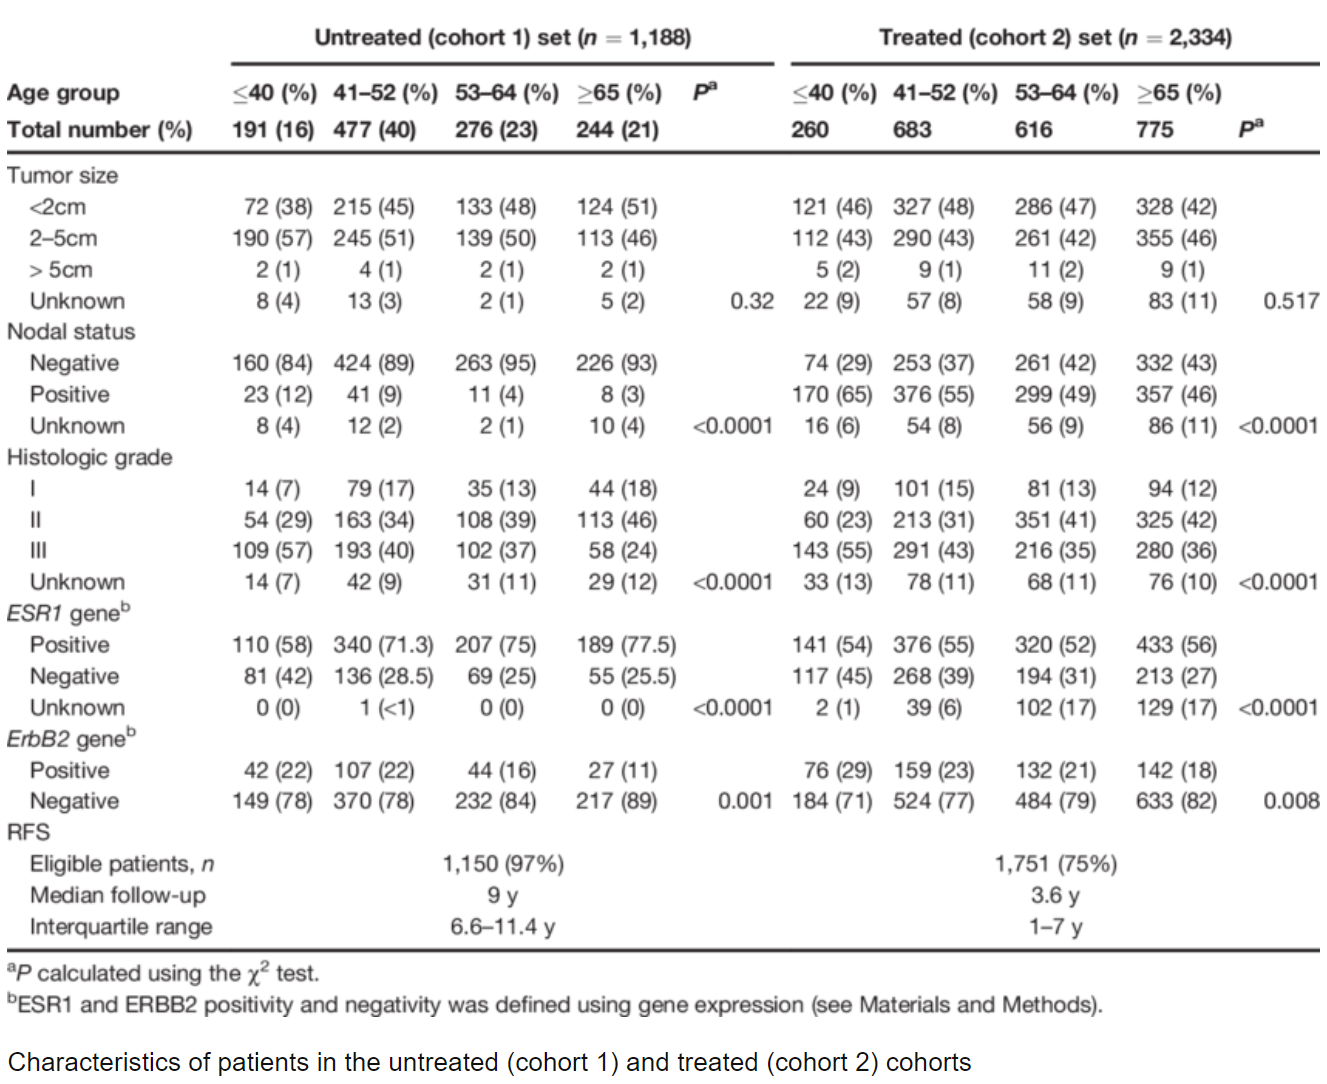
I will try to answer the question:
_Are there some convincing use cases for going beyond 2 levels of headers?_
I think the following are not perfect examples, but will hint at the real utility of going beyond 2 levels of headers:
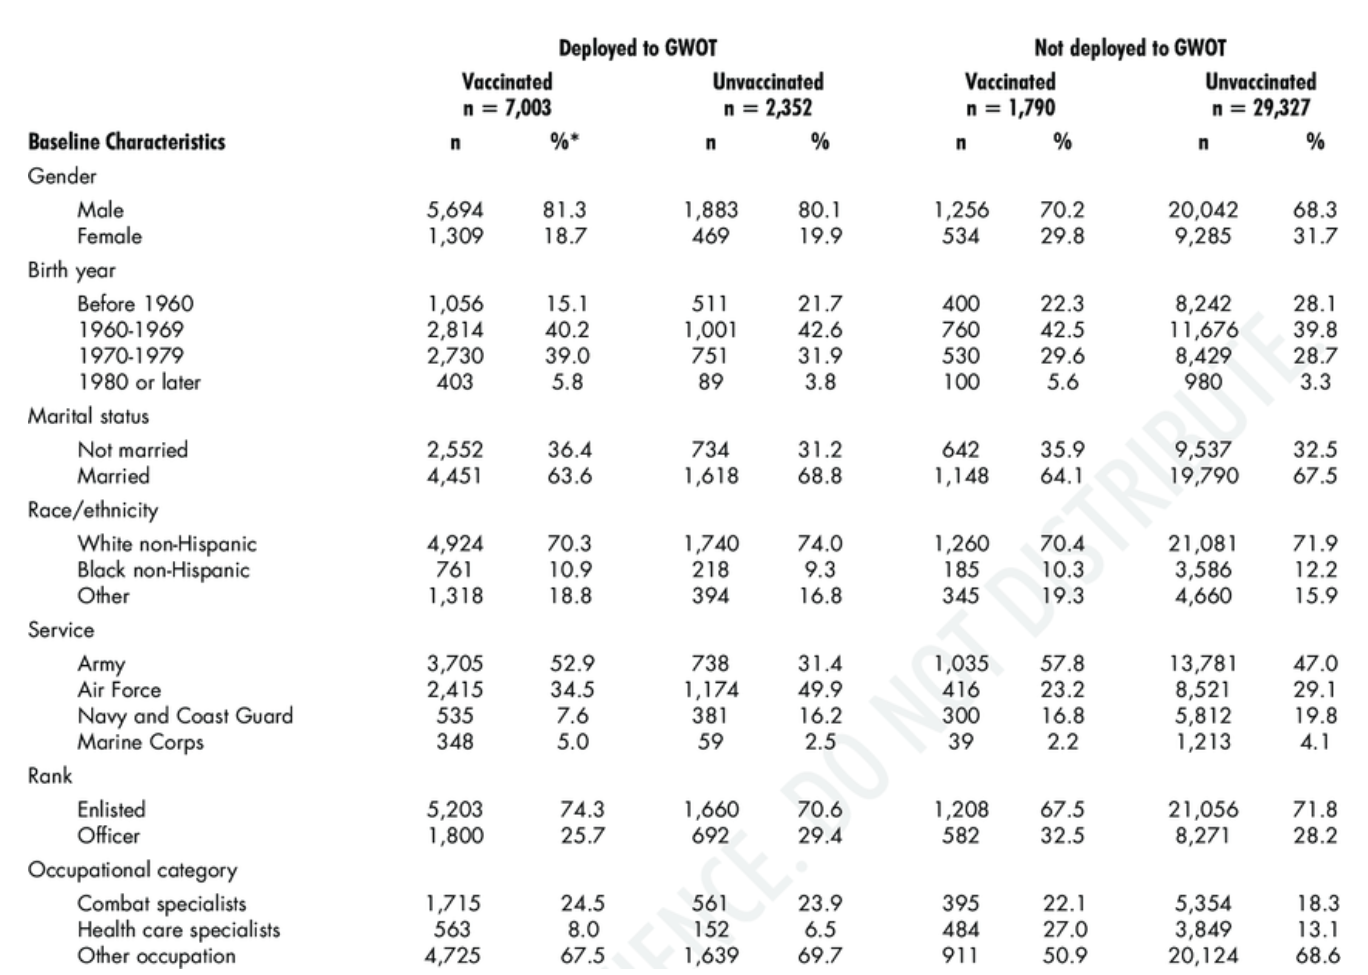
Source: https://www.researchgate.net/figure/Demographic-characteristics-of-Millennium-Cohort-Study-participants-by-smallpox_tbl1_5470825
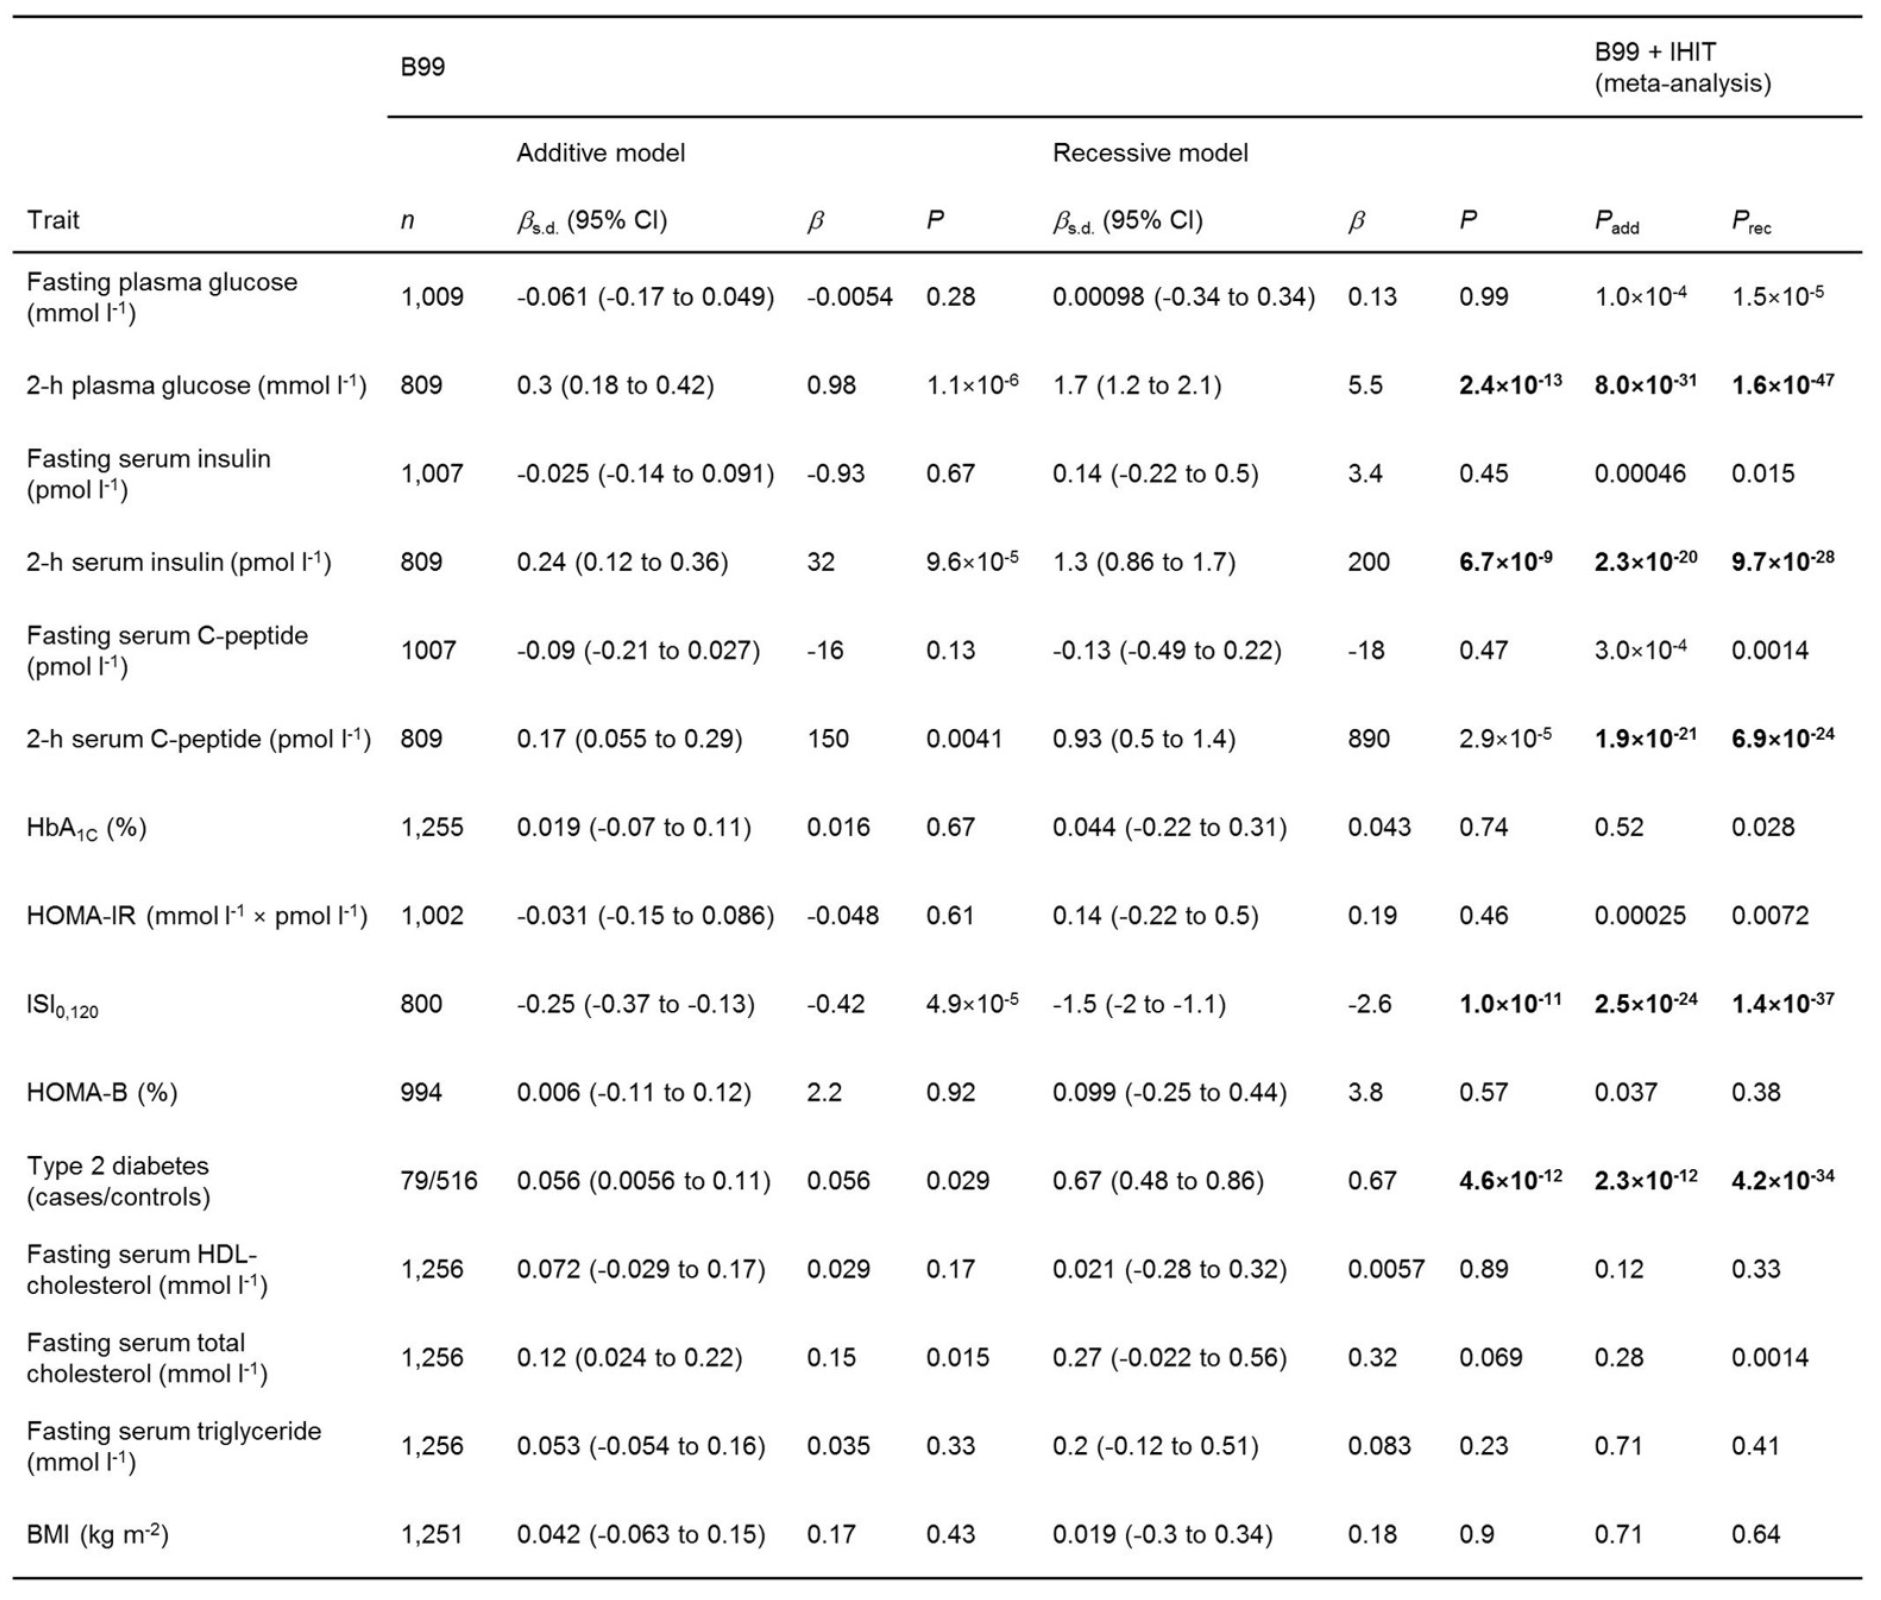
Source: https://www.nature.com/articles/nature13425/tables/4
But I understand that this probably takes a lot of work.
 rasmusrhl
on 1 Jul 2020
rasmusrhl
on 1 Jul 2020
FWIW, my gtsummary package mentioned upthread was renamed modelsummary. It now includes functions to produce crosstabs and data summaries. In that context, I constantly have to produce tables with more than one column span levels, and I always have to "flatten" headers when users want a gt table. In my view, there are many compelling use-cases for this.
You'll see several examples here:
https://vincentarelbundock.github.io/modelsummary/articles/datasummary.html
vincentarelbundock
on 1 Jul 2020
The comment by @rasmusrhl makes it clear that multiple levels of spanners/headers are a critical feature for producing scientific tables.
 awcm0n
on 10 Dec 2020
awcm0n
on 10 Dec 2020
Related issues
 steveputman
·
3Comments
steveputman
·
3Comments
 tbradley1013
·
3Comments
tbradley1013
·
3Comments
 TuSKan
·
6Comments
TuSKan
·
6Comments
 Torvaney
·
3Comments
Torvaney
·
3Comments
 higgi13425
·
3Comments
higgi13425
·
3Comments
Most helpful comment
I will try to answer the question:
_Are there some convincing use cases for going beyond 2 levels of headers?_
I think the following are not perfect examples, but will hint at the real utility of going beyond 2 levels of headers:

Source: https://www.researchgate.net/figure/Demographic-characteristics-of-Millennium-Cohort-Study-participants-by-smallpox_tbl1_5470825
Source: https://www.researchgate.net/figure/Characteristics-of-patients-in-the-untreated-cohort-1-and-treated-cohort-2-cohorts_tbl1_221763372
Source: https://www.nature.com/articles/nature13425/tables/4
But I understand that this probably takes a lot of work.