Grpc-go: Possible memory leak in resetTransport function
Please see the FAQ in our main README.md, then answer the questions below before
submitting your issue.
What version of gRPC are you using?
v.1.18.0
What version of Go are you using (go version)?
1.14.4
What operating system (Linux, Windows, …) and version?
Linux
What did you do?
If possible, provide a recipe for reproducing the error.
I have a simple web server which does google oauth2 authorizations. It also connects to some of our internal services using grpc. There seem to be a steady increase in memory usage over time and it wont get collected by GC. I downloaded profiles to debug the leak and saw there is no leak due to application code. I see that leaks are due to context.WithCancel and newBufWriter within grpc transports
Here is the code for connecting to grpc server from my auth server.
settingsClient, err: = clients.NewSettingsClient(getAddress("settings"), grpc.WithInsecure())

md: = metadata.Pairs("x-id", namespace)
ctx: = metadata.NewOutgoingContext(context.Background(), md)

config, err: = settingsClient.GetSettings(ctx, & settings_api.Config
{
    Key: "Application_Info"
})
userClient, err: = clients.NewUserClient(getAddress("user"), grpc.WithInsecure())

md: = metadata.Pairs("x-id", namespace)
ctx: = metadata.NewOutgoingContext(context.Background(), md)

response, err: = userClient.GetActiveToken(
    ctx, & user_api.Info
    {
        Name: user.Email
    },
)
Here is the heap profile output:
go tool pprof heap.out
File: authserver
Type: inuse_space
Time: Jun 4, 2020 at 6:23pm (IST)
Entering interactive mode (type "help" for commands, "o" for options)
(pprof) top
Showing nodes accounting for 202.30MB, 97.59% of 207.30MB total
Dropped 57 nodes (cum <= 1.04MB)
Showing top 10 nodes out of 24
flat flat% sum% cum cum%
74.51MB 35.94% 35.94% 76.01MB 36.67% runtime.systemstack
67.50MB 32.56% 68.51% 68.50MB 33.05% context.WithCancel
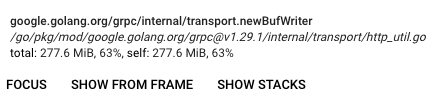
35.64MB 17.19% 85.70% 35.64MB 17.19% github.com/dinesh/authserver/vendor/google.golang.org/grpc/internal/transport.newBufWriter (inline)
21.15MB 10.20% 95.90% 21.15MB 10.20% bufio.NewReaderSize (inline)
1.50MB 0.72% 96.62% 1.50MB 0.72% runtime.malg
1MB 0.48% 97.10% 2MB 0.97% github.com/dinesh/authserver/vendor/google.golang.org/grpc.(*ClientConn).newAddrConn
0.50MB 0.24% 97.35% 1.50MB 0.72% github.com/dinesh/authserver/vendor/google.golang.org/grpc.DialContext
0.50MB 0.24% 97.59% 57.28MB 27.63% github.com/dinesh/authserver/vendor/google.golang.org/grpc/internal/transport.newHTTP2Client
0 0% 97.59% 2.50MB 1.21% github.com/dinesh/authserver/source/server.(*AuthServer).GoogleOAuthTokenHandler
0 0% 97.59% 57.28MB 27.63% github.com/dinesh/authserver/vendor/google.golang.org/grpc.(*addrConn).createTransport
Flame Graph:
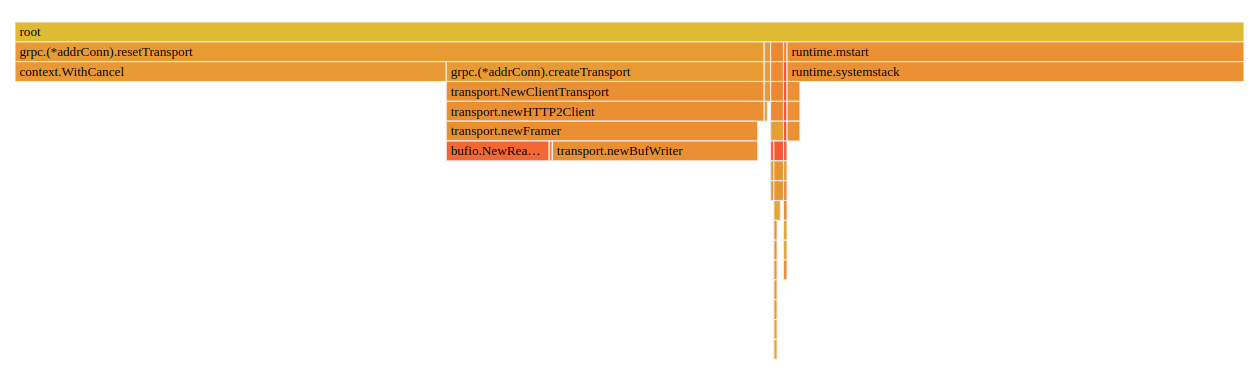
I read here that if we don't send context timeout's to grpc call there will be a possible mem leak. I just wanted to confirm if this is the same issue or anything different.
What did you expect to see?
Expected that the allocated memories being collected by GC.
What did you see instead?
Memory bloating over time and need system restart
 dineshgowda24
All 6 comments
i have same issue newBufWriter and NewReadSize leak
 gobenpark
on 8 Jun 2020
gobenpark
on 8 Jun 2020
I tested with v1.24.0 grpc, the leaky context is resolved and I don't see it showing up in heap.
But still bufio.NewReaderSize and transport.newBufWriter leaks in v1.24.0.
➜  grpc-24 git:(errors) ✗ go tool pprof -nodefraction=0 heap
File: authserver
Type: inuse_space
Time: Jun 8, 2020 at 3:18pm (IST)
Entering interactive mode (type "help" for commands, "o" for options)
(pprof) top
Showing nodes accounting for 3153.22kB, 100% of 3153.22kB total
Showing top 10 nodes out of 38
      flat  flat%   sum%        cum   cum%
 1584.50kB 50.25% 50.25%  1584.50kB 50.25%  bufio.NewReaderSize
  544.67kB 17.27% 67.52%   544.67kB 17.27%  github.com/dinesh/authserver/vendor/google.golang.org/grpc/internal/transport.newBufWriter
  512.05kB 16.24% 83.76%   512.05kB 16.24%  github.com/dinesh/authserver/google.golang.org/grpc/internal/grpcsync.NewEvent
  512.01kB 16.24%   100%   512.01kB 16.24%  reflect.(*structType).Field
         0     0%   100%   512.01kB 16.24%  crypto/tls.(*Conn).Handshake
         0     0%   100%   512.01kB 16.24%  crypto/tls.(*Conn).clientHandshake
         0     0%   100%   512.01kB 16.24%  crypto/tls.(*Conn).verifyServerCertificate
         0     0%   100%   512.01kB 16.24%  crypto/tls.(*clientHandshakeStateTLS13).handshake
         0     0%   100%   512.01kB 16.24%  crypto/tls.(*clientHandshakeStateTLS13).readServerCertificate
         0     0%   100%   512.01kB 16.24%  crypto/x509.(*CertPool).AppendCertsFromPEM
As added by @BumwooPark it seems that the issue is there in v.1.29.1 as well. Can any one please confirm this?
dineshgowda24
on 8 Jun 2020
1584.50kB
This is 1.5MB. This doesn't seem excessive to me. How many connections do you have (incoming and outgoing) at this time?
 dfawley
on 11 Jun 2020
dfawley
on 11 Jun 2020
i solved this problem
i see many connection established so fix client connection only one
gobenpark
on 12 Jun 2020
This was an issue from old version before 1.24 where cancel context's were leaking. Apart from that I was using multiple connections reduced it to single connection. Solved the issue.
dineshgowda24
on 12 Jun 2020
@dineshgowda24 I had the same problem with 1.19.1 version. Can you specify how it was solved? Upgrade version?
I looked at the source code:
func (ac *addrConn) resetTransport() {
    addrLoop:
        for _, addr := range addrs {
            // .....
            hctx, hcancel := context.WithCancel(ac.ctx)
            defer hcancel()
                        newTr, err := ac.createTransport(addr, copts, connectDeadline, reconnect, prefaceReceived)
                        if err == nil {
                            // ....
                        }else{
                                hcancel()
                if err == errConnClosing {
                    return
                }
                if tryNextAddrFromStart.HasFired() {
                    break addrLoop
                }
                continue
                }

      //......
}
When createTransport func return err != nil , hcancel() is cancel context,Why would it leak?
I would like to analyze the specific causes of the leakage,please help guide
 phachon
on 15 Jul 2020
phachon
on 15 Jul 2020
Related issues
 aburluka
·
3Comments
aburluka
·
3Comments
 felixwang66
·
3Comments
felixwang66
·
3Comments
 ahmetb
·
4Comments
ahmetb
·
4Comments
 fho
·
3Comments
fho
·
3Comments
 23doors
·
3Comments
23doors
·
3Comments
Most helpful comment
I tested with
v1.24.0grpc, the leaky context is resolved and I don't see it showing up in heap.But still
bufio.NewReaderSizeandtransport.newBufWriterleaks inv1.24.0.As added by @BumwooPark it seems that the issue is there in
v.1.29.1as well. Can any one please confirm this?