Graphql-shield: Performance degradation after applying graphql-shield
Bug report
- [x] I have checked other issues to make sure this is not a duplicate.
Describe the bug
Querying multiple fields for hundreds of rows becomes noticeably slower after applying graphql-shield middleware.
To Reproduce
I've created repository reproducing this issue:
https://github.com/lynxtaa/graphql-shield-performance
- Without
graphlql-shieldit takes 30-40ms to query all users. - With
graphql-shieldit takes ~260ms.
Notice that I'm not applying any rules for type User.
Is there a way to improve performance for large queries?
 lynxtaa
All 19 comments
Hey @lynxtaa :wave:,
Thank you for opening an issue. We will get back to you as soon as we can. Also, check out our Open Collective and consider backing us.
https://opencollective.com/graphql-shield
PS.: We offer
prioritysupport for all backers. Don't forget to addprioritylabel when you start backing us :smile:
![open-collective-bot[bot] picture](https://avatars.githubusercontent.com/in/23739?v=4&s=40) open-collective-bot[bot]
on 27 Jun 2019
open-collective-bot[bot]
on 27 Jun 2019
@lynxtaa could you share the rule-set that you are using? I believe the problem might stem from your cache option. The problem is that graphql-shield runs on every field; because of that, if a rule execution takes 20ms and the cache is set incorrectly, the sum of the tasks might easily reach 300ms on multiple thousands of records.
 maticzav
on 29 Jun 2019
maticzav
on 29 Jun 2019
@maticzav , you can check the example in provided repository: https://github.com/lynxtaa/graphql-shield-performance/blob/master/server.js:
const isAuthenticated = rule()((parent, args, ctx, info) => ctx.user !== null)

const permissions = shield({
  Mutation: {
    createSomething: isAuthenticated,
  },
})
Is it necessary to run rules on fields for which I didn't set any permissions?
lynxtaa
on 29 Jun 2019
Ah yes! We’ve made a change to default cache option. I’ll document the change more evidently. For now, try setting the cache option to contextual. I recommend you read the docs to prevent any potential security leaks.
TLDR: we’ve adjusted the default cache option to prevent leaks. As a consequence it is possible to experience high performance spikes.
maticzav
on 29 Jun 2019
I've tested with cache: contextual and see no improvement. Even with empty ruleset (shield({})) performance degrade noticeably.
| | First run | Second run |
| ------------- | ------------- | ------------- |
| Without graphql-shield | 76ms | 28ms |
| With empty ruleset | 203ms | 167ms |
| With cache: contextual | 230ms | 143ms |
lynxtaa
on 29 Jun 2019
@maticzav I think it has something to do with typescript compilation of async functions. After some experimenting I've compiled graphql-shield with target: ESNext in tsconfig.json and the performance is much better: it takes 108ms on first call, then 59ms on second call.
Can you consider dropping Node 6 support and start compiling to es2017?
lynxtaa
on 30 Jun 2019
Could you create a PR, and if possible add a short benchmarking script?
That would be invaluable to me.
maticzav
on 30 Jun 2019
@maticzav @lynxtaa thanks for providing info on this. While this has improved our case slightly it is still not at an acceptable level in terms of memory, CPU, and garbage collection. There are some graphs below:
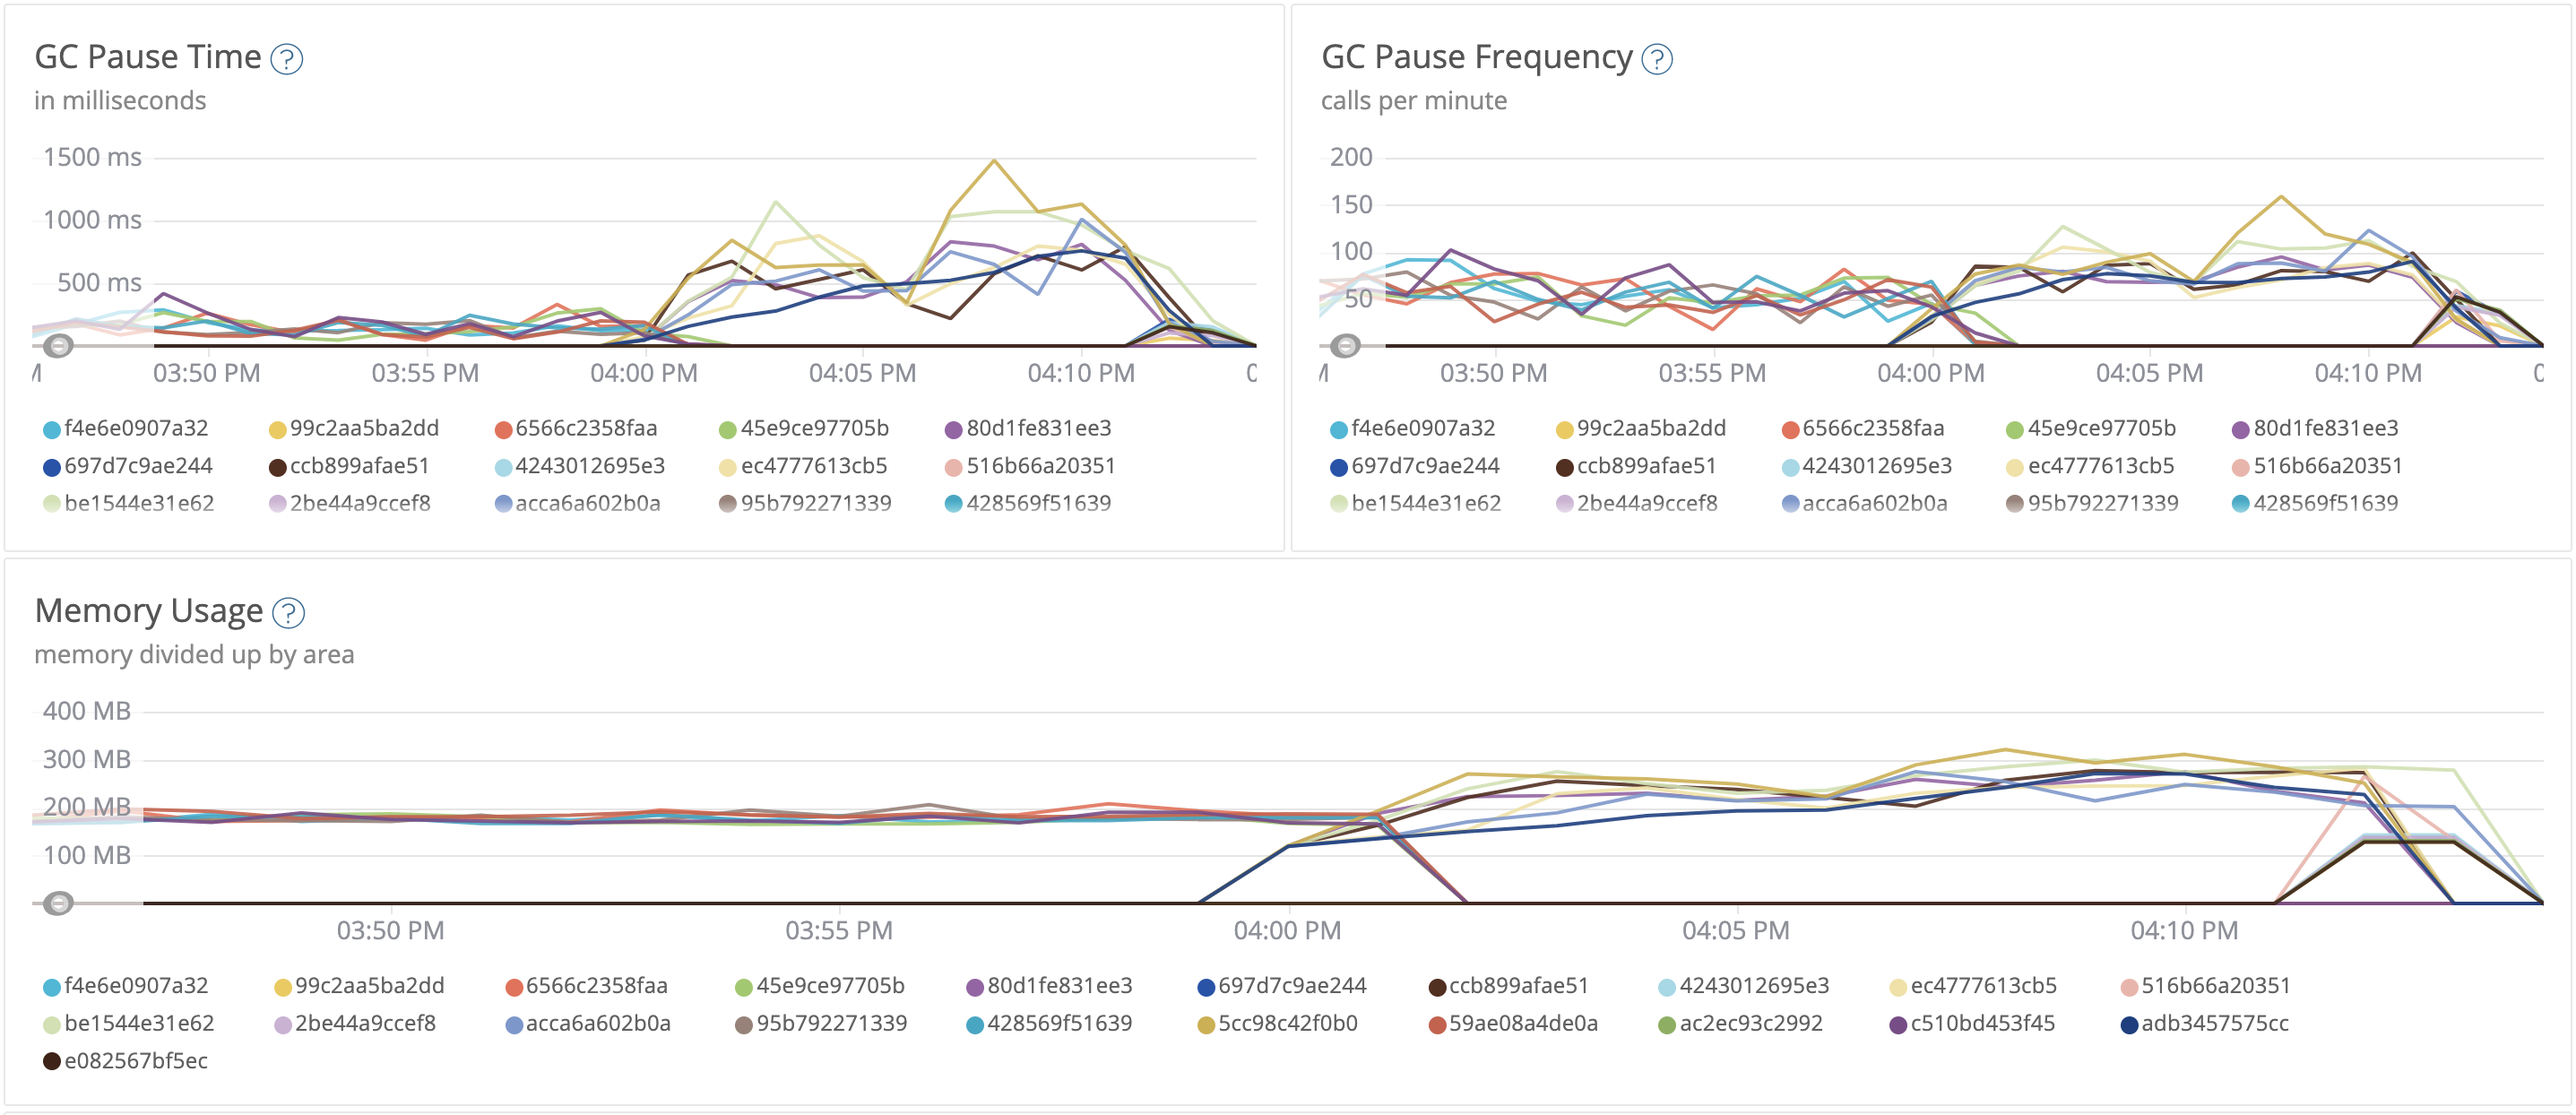
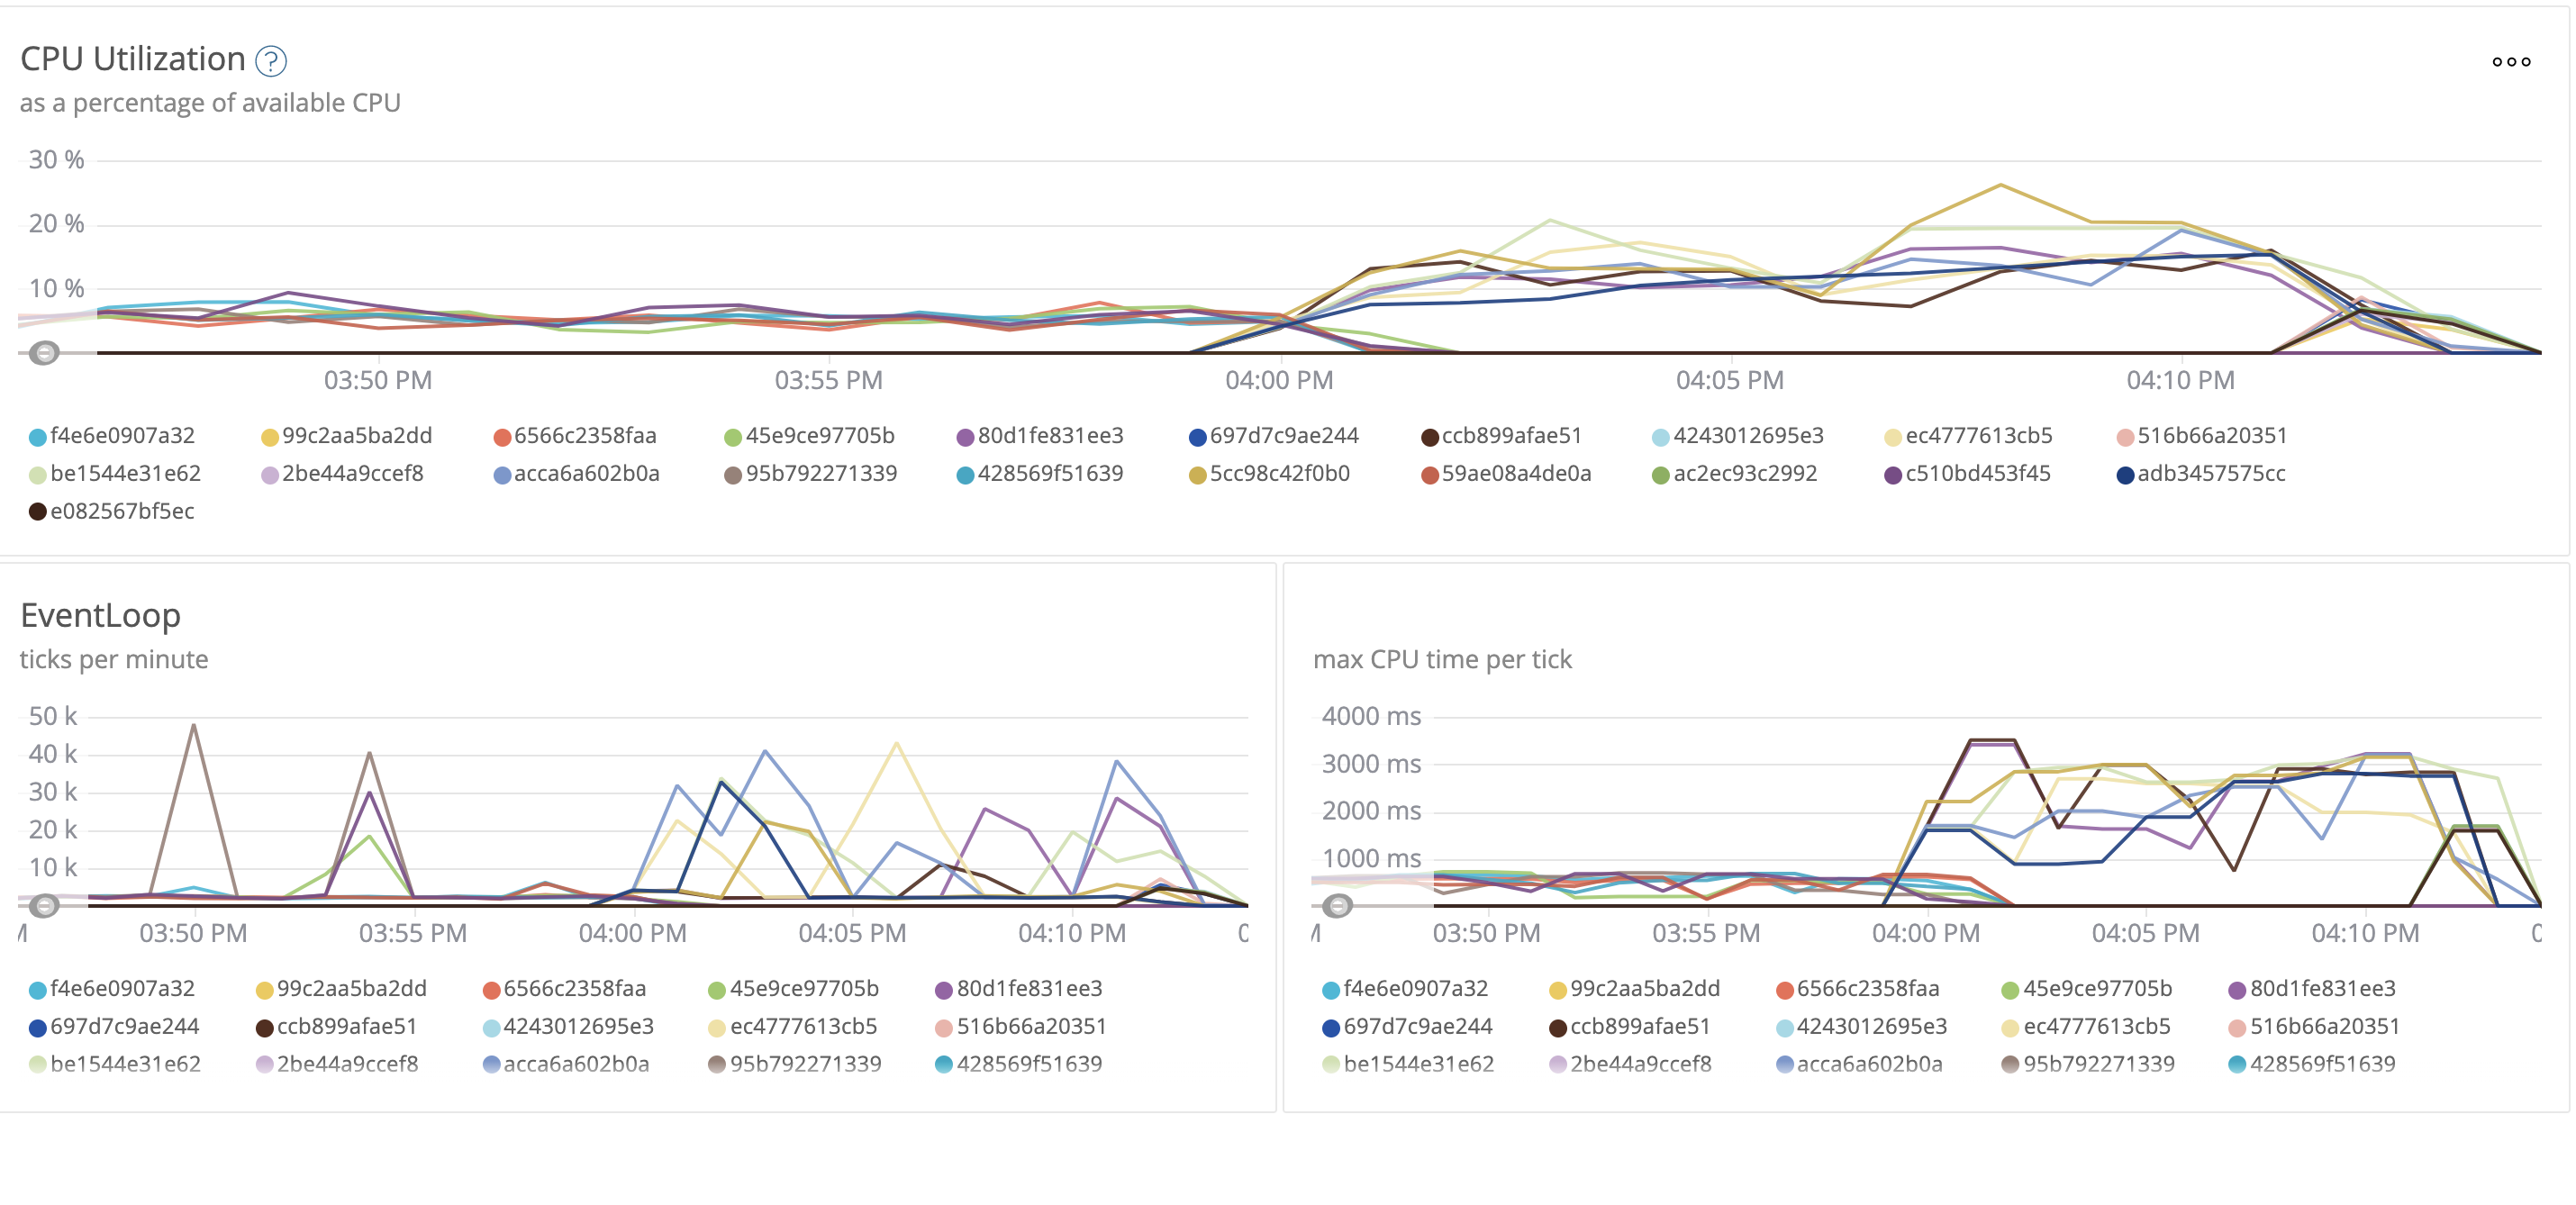
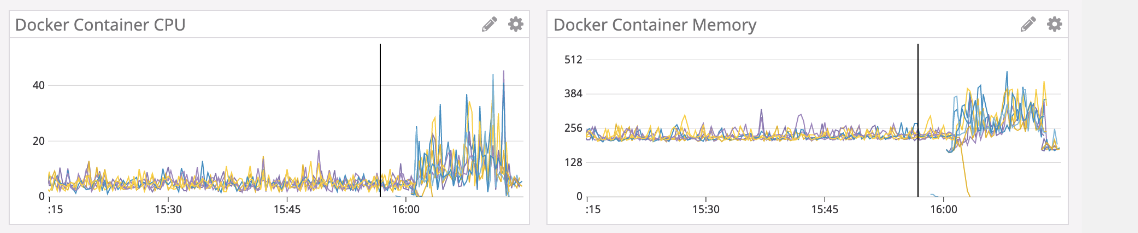
This is with an empty rule set, so the caching is not specified anywhere. What is the cache policy on the default fallback rule? Any other ideas / pointers?
 ltamrazov
on 2 Jul 2019
ltamrazov
on 2 Jul 2019
Could this be related to: https://github.com/prisma/graphql-middleware/issues/24 ?
ltamrazov
on 2 Jul 2019
@maticzav @lynxtaa I tried to do a bit more experimenting with profiling and looking at the garbage collection patterns. I'm no expert in either of these topics but I'm hoping what I found helps. I added a repo here to do the testing.
I setup a GraphQL server running on Express with a basic GraphQL schema that returns a list of Movies with 8 attributes. For the tests I randomly generated 100 movies to be returned in the GQL query. I used a resolver that pauses by 10s then returns (my attempt at poor man's request queueing).
I used vegeta to do some load testing. When I tried doing 350req/s for 1m I noticed that when Shield was applied, there was twice as much garbage collection as when Shield middleware wasn't there. I showed the results in the README of the project. Also, it would run out of memory ever so often when Shield was applied.
Finally, I used the v8-profiler-next to profile the system under load. I looked at the profiles in Chrome's Javascript Profiler but not too much jumped out at me.
This profile shows running 350req/s with the 10s. Then I changed the resolver to return after 3s and recorded the results with Shield and without Shield. One caveat is that I had to stop the load testing early for Shield so that the NodeJS process didn't quit on me. I needed to save the profile.
From the little I gleaned from the profiles, it confirms that the garbage collection takes longer. Compare with Shield...

To without Shield...

Hope this helps!
 jaywhy13
on 4 Jul 2019
jaywhy13
on 4 Jul 2019
@maticzav I think this issue should be reopened. Graphql-shield indeed runs faster after dropping Node 6 but performance impact is still significant.
lynxtaa
on 4 Jul 2019
Thank you both for such profound insights on the performance. I am away for a vacation and will return on Tuesday.
maticzav
on 5 Jul 2019
@maticzav any updates on this? We've recently tried to apply shield using the new applyMiddlewareToDeclaredResolvers from graphql-middleware but the results are the same, that didn't seem to help.
ltamrazov
on 12 Jul 2019
This could be a potential show stopper for using graphql-shield
 Jaikant
on 23 Jul 2019
Jaikant
on 23 Jul 2019
@maticzav any updates on this by any chance?
jaywhy13
on 9 Aug 2019
@jaywhy13 indeed. We've dropped support for node6 in graphql-middleware which, as you mentioned, handled promises very poorly. That and a couple of internal changes in the graphql-shield should, I believe, bring performance improvements to the library.
I tried using your testing tool but ran into problems. Could you retry running tests?
maticzav
on 26 Aug 2019
@maticzav we have tried again, and i can confirm that there are no performance issues anymore, after this fix
 rostislavv
on 10 Oct 2019
rostislavv
on 10 Oct 2019
Thanks to @rostislavv, this issue should be fixed.
maticzav
on 11 Oct 2019
I also noticed this issue on mac os. I tried my app on both linux and mac os. I notice this performance issue only on mac os. About 20 times performance degrade. But upgrading graphql-shield to the latest stable version in my case 7 fixed the issue. Now it is running as fast as linux
 dulara1994
on 26 Dec 2019
dulara1994
on 26 Dec 2019
Related issues
 artemzakharov
·
8Comments
artemzakharov
·
8Comments
 tnolan8
·
5Comments
tnolan8
·
5Comments
 ellipticaldoor
·
7Comments
ellipticaldoor
·
7Comments
 Paulooze
·
7Comments
Paulooze
·
7Comments
 donedgardo
·
6Comments
donedgardo
·
6Comments
Most helpful comment
@maticzav @lynxtaa I tried to do a bit more experimenting with profiling and looking at the garbage collection patterns. I'm no expert in either of these topics but I'm hoping what I found helps. I added a repo here to do the testing.
I setup a GraphQL server running on Express with a basic GraphQL schema that returns a list of
Movieswith 8 attributes. For the tests I randomly generated 100 movies to be returned in the GQL query. I used a resolver that pauses by10sthen returns (my attempt at poor man's request queueing).I used
vegetato do some load testing. When I tried doing350req/sfor1mI noticed that when Shield was applied, there was twice as much garbage collection as when Shield middleware wasn't there. I showed the results in the README of the project. Also, it would run out of memory ever so often when Shield was applied.Finally, I used the
v8-profiler-nextto profile the system under load. I looked at the profiles in Chrome's Javascript Profiler but not too much jumped out at me.This profile shows running
350req/swith the10s. Then I changed the resolver to return after3sand recorded the results with Shield and without Shield. One caveat is that I had to stop the load testing early for Shield so that the NodeJS process didn't quit on me. I needed to save the profile.From the little I gleaned from the profiles, it confirms that the garbage collection takes longer. Compare with Shield...

To without Shield...

Hope this helps!