Graphql-engine: Hasura consuming massive amounts of memory
We recently ended up shutting down our production Hasura deployment, because we were only using it for data ingestion, and we ended up in a situation where Hasura was constantly using all available memory, and then crashing.
I don't have any logs to offer, unfortunately. But I was asked on Discord to create an issue, so here's the information I can provide about our setup:
- Deployed on Heroku
- Initially ran on a $7/mo box on v1alpha1 build 28 (We didn't watch it closely, and at some point realized that it was crashing regularly from running out of memory)
- Scaled the box to larger standard dynos, even up to 3 boxes with 2.5Gb of ram each. Even in that situation, Hasura used all and more than the available ram, and was killed by Heroku.
- Heroku's router measurements said we were getting about 10 reqs / second from our client devices.
- The client devices were doing mutations only. No queries. They were writing in telemetry events.
- Sometimes queries could be multiple megabytes in size (a lot of events were in the write backlog)
- We used an auth hook to our application server that responded usually within a few hundred milliseconds.
- Sometimes the auth hook would throw a 500 error.
- Right before crashing the Hasura logs showed mutation requests timing out (taking longer than 30 seconds)
- Rebooting the box helped for a few seconds, but the slowness almost immediately returned.
- We truncated our events table to make sure the database wasn't the bottleneck, but the memory issues on Hasura continued.
Sorry I can't offer more. Thank you!
 mrmurphy
All 39 comments
@mrmurphy Thanks for creating the issue!
Seems like you were using Event Triggers on the tables. It is possible that the memory buildup was happening because of our in-memory queue (especially if there were lots of unprocessed events) for holding events which has now been removed with this PR: https://github.com/hasura/graphql-engine/pull/4013
The next stable release i.e. v1.2.0 should have this new change and is likely to solve your problem.
 tirumaraiselvan
on 11 Mar 2020
tirumaraiselvan
on 11 Mar 2020
Oh, sorry about that. No, we weren’t using Hasura Events,we were using Hasura to record client-side telemetry events. So the event queue I mentioned was a client-side queue of events to send to the server.
On Mar 11, 2020, 5:27 AM -0600, Tirumarai Selvan notifications@github.com, wrote:
@mrmurphy Thanks for creating the issue!
Seems like you were using Event Triggers on the tables. It is possible that the memory buildup was happening because of our in-memory queue (especially if there were lots of unprocessed events) for holding events which has now been removed with this PR: #4013
The next stable release i.e. v1.2.0 should have this new change and is likely to solve your problem.
—
You are receiving this because you were mentioned.
Reply to this email directly, view it on GitHub, or unsubscribe.
mrmurphy
on 11 Mar 2020
@mrmurphy Ah, got it. We will look into it.
I would also recommend to upgrade to latest stable if possible.
tirumaraiselvan
on 11 Mar 2020
Ah sorry, I forgot to mention that as well. As part of the debugging process we upgraded to 1.1.0 and had the same issue
On Mar 11, 2020, 11:16 AM -0600, Tirumarai Selvan notifications@github.com, wrote:
@mrmurphy Ah, got it. We will look into it.
I would also recommend to upgrade to latest stable if possible.
—
You are receiving this because you were mentioned.
Reply to this email directly, view it on GitHub, or unsubscribe.
mrmurphy
on 11 Mar 2020
@mrmurphy
The client devices were doing mutations only. No queries. They were writing in telemetry events.
Sometimes queries could be multiple megabytes in size (a lot of events were in the write backlog)
Can you provide more details on the mutation?
- Is it a mutation on a single table or multiple tables through relationships?
- Are there permissions defined for the role with which the mutation goes through?
- Can you share the mutation and the schema of your database? This can help us reproduce this issue on our end.
There are no other queries/subscriptions to the system?
 0x777
on 12 Mar 2020
0x777
on 12 Mar 2020
Most queries were just inserting to a single table. Some queries (sent much less often) were doing an "on conflict do update". I wish I could dig deeper into that one for you now, but we've removed the infrastructure, and also those events.
The majority of traffic inserted into a table like this:
CREATE TABLE "public"."event" (
    "a" text,
    "b" int8,
    "c" text,
    "d" text,
    "e" text,
    "f" text,
    "g" int4,
    "h" text,
    "i" text,
    "j" text,
    "k" jsonb,
    "id" int4 NOT NULL DEFAULT nextval('event_id_seq'::regclass),
    "l" text,
    "m" text,
    "n" text,
    "o" jsonb,
    "p" text,
    "q" text,
    "r" bool,
    "s" text,
    "t" text,
    "u" text,
    "v" text,
    "w" text,
    "x" text,
    "y" text,
    "z" text,
    "aa" int8,
    "ab" timestamptz DEFAULT now(),
    PRIMARY KEY ("id")
);
With some indexes on those columns. All indexes were btree. The ID column index was unique. One was on a json column with a condition, making it a partial index.
mrmurphy
on 13 Mar 2020
And a similar table with only 9 columns. Both of those tables, which accounted for most of the traffic, just appended new rows to the end of the table.
mrmurphy
on 13 Mar 2020
@0x777 I wonder if it's possible hasura events were being generated and collected despite not being enabled/configured from user's point of view. I'll think about that and also take a close look at the mutations code path
 jberryman
on 14 Mar 2020
jberryman
on 14 Mar 2020
(Linking to #3388 which I've been using as the canonical memory leak issue, for referencing in PRs, etc.)
jberryman
on 16 Mar 2020
Played with inserts of the form above, and stared at the codepaths for a bit and still not able to reproduce this, unfortunately...
jberryman
on 19 Mar 2020
@mrmurphy We've released v1.1.1 which incorporates few fixes for space leaks (most likely cause of massive memory consumption in Haskell programs), can you please try it out and let us know?
0x777
on 30 Mar 2020
Thank you so much, Vamshi! Unfortunately we’ve already taken Hasura out of our infrastructure and won’t have the bandwidth to test out the new release. I’m sorry. I hope other users will be able to confirm the fixes for you.
On Mar 30, 2020, 1:32 AM -0600, Vamshi Surabhi notifications@github.com, wrote:
@mrmurphy We've released v1.1.1 which incorporates few fixes for space leaks (most likely cause of massive memory consumption in Haskell programs), can you please try it out and let us know?
—
You are receiving this because you were mentioned.
Reply to this email directly, view it on GitHub, or unsubscribe.
mrmurphy
on 30 Mar 2020
we upgraded to 1.1.1 and had the same issue
{"type":"unstructured","timestamp":"2020-04-18T04:00:40.952+0000","level":"error","detail":"Received STOP for an operation OperationId {unOperationId = \"9\"} we have no record for. this could be a misbehaving client or a bug"}
{"type":"unstructured","timestamp":"2020-04-18T04:00:40.952+0000","level":"error","detail":"Received STOP for an operation OperationId {unOperationId = \"10\"} we have no record for. this could be a misbehaving client or a bug"}
{"type":"unstructured","timestamp":"2020-04-18T04:00:41.953+0000","level":"error","detail":"Unexpected exception raised in websocket. Please report this as a bug: Thread killed by Warp's timeout reaper"}
{"type":"unstructured","timestamp":"2020-04-18T04:00:41.953+0000","level":"error","detail":"Unexpected exception raised in websocket. Please report this as a bug: Thread killed by Warp's timeout reaper"}
 haohedev
on 18 Apr 2020
haohedev
on 18 Apr 2020
Version 1.1.1 has a more serious problem, which will cause the program to die and the memory will continue to increase. This problem has occurred many times in a row
haohedev
on 19 Apr 2020
I am not using Heroku, the database is using the official image postgres:10 ,including postgis extension
haohedev
on 29 Apr 2020
@haohedev have you tried replicating this on 1.2.1, just to make sure this isn't something they've already fixed?
@jberryman We're seeing similar massive RAM consumption from very simple queries. We are also on 1.1.1 and will try to replicate on 1.2.1 before trying to contribute to this issue.
 jflambert
on 20 May 2020
jflambert
on 20 May 2020
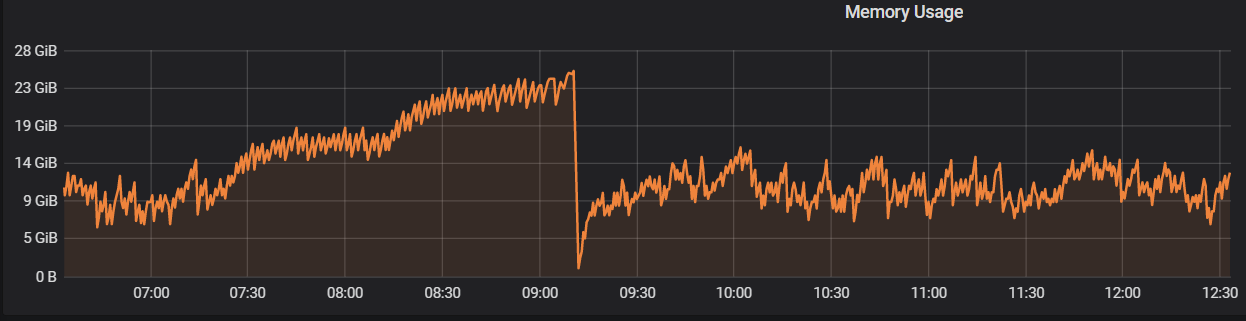
Upgrading to 1.2.1 didn't change much. Hasura is still very memory-hungry for simple queries. I thought most of the RAM required for converting rows to JSON would be consumed by Postgres, not Hasura.
jflambert
on 25 May 2020
@jflambert Can you try running this image: hasura/graphql-engine:pull4778-676ea20b and tell us your observations?
tirumaraiselvan
on 25 May 2020
@tirumaraiselvan this is the 1.2.2 RC if I understand correctly? No real difference. We're seeing Hasura shoot up to 4GB of RAM for a simple query pulling in about 1 million rows of simple telemetry data (timestamp, JSON payload). RAM remains high, eventually dropping to 3GB after 10-15 minutes of no usage. Postgres remains at a steady 1.5GB throughout. Is this normal?
Have you measured this kind of "vertical" scaling? Our normal use case is very few concurrent queries, large results. Is Hasura wrong for this application?
jflambert
on 25 May 2020
this is the 1.2.2 RC if I understand correctly?
Correct.
We're seeing Hasura shoot up to 4GB of RAM for a simple query pulling in about 1 million rows of simple telemetry data (timestamp, JSON payload)
What is the response size of this query? How many concurrent requests do you see? Currently, graphql-engine fetches the entire result set from Postgres into memory before sending it to the http client (HTTP is not best suited for streaming results to the client directly).
RAM remains high, eventually dropping to 3GB after 10-15 minutes of no usage. Postgres remains at a steady 1.5GB throughout. Is this normal?
High RAM consumption of graphql-engine when there are no requests would suggest a bug in graphql-engine but Postgres RAM consumption remaining at 1.5GB suggests that there is some usage? Or do you have any other applications connecting to Postgres directly which would explain Postgres's RAM conumption?
cc @jberryman
0x777
on 26 May 2020
@0x777 I'm going to try my best to setup a self-contained environment you can also use to replicate the memory consumption. Before I do that, let me make sure I calculate the RAM correctly. I use the RES column in htop. Do you have another preference?
jflambert
on 26 May 2020
@jflambert That would be tremendously helpful, thanks!
htop's RES field is fine. You might also run with the command line arguments +RTS -h -s -RTS. -h will generate a heap profile with the name graphql-engine.hp. This might become very large if the server runs for longer than a few minutes, so you might omit that
jberryman
on 26 May 2020
@0x777 and @jberryman I've put together a bundle that should illustrate our "problem"
I say "problem" because in fact we're not sure if this is expected behavior from Hasura or not.
Please try for yourself and compare against my findings.
jflambert
on 28 May 2020
Also finding issues with Memory usage on Hasura
We do multi table queries through the permission engine. Recently had to up the memory to 2GB and it currently sites at 64% utilisation of this!
We are using 1.2.1
We build through your docker image
image: hasura/graphql-engine
 iwarner
on 31 May 2020
iwarner
on 31 May 2020
We are seeing a similar RAM consumption
We are using 1.2.2
The memory drop is due to the daily restart. Is this considered to be normal with an almost constant number of req/s?
 perrosnk
on 10 Jun 2020
perrosnk
on 10 Jun 2020
We are experiencing the same issue.
Using version 1.2.2
 tellefsen
on 11 Jun 2020
tellefsen
on 11 Jun 2020
I'm testing with version 1.3.0-beta.1 and the results are even worse. I see RAM shoot up to 8GB with my simple test tool.
jflambert
on 12 Jun 2020
I appreciate the input here! We've isolated a couple of related issues (the dominant one being essentially this) and some fixes will be opened against master soon. The commits will link this ticket.
jberryman
on 13 Jun 2020
Don't know if this is related: When editing permissions in the console I often have to wait for minutes. Sometimes the console tells me that memory has maxed out. Sometimes I get other errors about metadata. After reloading the metadata I can usually edit one to three permissions, then this happens again. Basically I can not use the console to edit permissions any more. Once I got an error telling me a constraint hdb_permissions_??? (sorry, forgot) was being violated.
Looking at the logs of the virtual droplet I see:

This is the smallest droplet on digital ocean. But I have never yet managed to max such a droplet out.
Am using 1.3.0-beta.1 in docker.
Maybe unrelated but because it was mentioned above: Many of my queries use "on conflict do update". Don't see why that would influence changing permissions though.
 barbalex
on 17 Jun 2020
barbalex
on 17 Jun 2020
We are seeing a similar RAM consumption
We are using 1.2.2
The memory drop is due to the daily restart. Is this considered to be normal with an almost constant number of req/s?
Same here. We just upgraded to 1.2.2 and our Heroku memory quota was exceeded
 evancorl
on 17 Jul 2020
evancorl
on 17 Jul 2020
@evancorl are you observing a regression when upgrading to 1.2.2? Do those drops in memory usage represent a restart?
Also if you're comfortable sharing your schema and/or data-set and what sorts of queries you're making over direct message that is always helpful. Finally, there are quite a few memory-related fixes in the beta pipeline. Please let us know if you find they fix your issue
jberryman
on 19 Jul 2020
We are seeing the same memory issues. We are running version 1.3 (latest release) and have a small DB, 56MB in size running on Google Cloud Run that I have configured with 1 Gig of ram. . Even with 0 queries, just sitting idle, the memory usage shows over 70%...and with just a single user, running standard queries (less then 1 req/s)...memory starts getting up to 100% and we start getting errors due to memory limitations within an hour.
I should mention, the queries we execute are large/complex. Here is an example of query we run
query {
records:schema_52_tbl_244_aggregate {
aggregate {
count
}
}
tabledata:schema_52_tbl_244(order_by: {id: asc},limit: 500, offset: 0) {
CustomID{fullname} field_2 field_1 field_3 field_18_options {data:field_18_options_join {option optionid attributes rank}} field_16_options {data:field_16_options_join {option optionid attributes rank}} field_9_options {data:field_9_options_join {option optionid attributes rank}} tbl_244_field_13_max {id data} id
field_5_join (limit:50) {tbl_247 {field_1 id CustomID {fullname} } }field_11_join (limit:50) {tbl_250 {field_1 id } }field_12_join (limit:50) {tbl_246 {field_1 id } }
}
}
With a DB 56MB in size, it should be able to load the entire DB into memory and still be under 100MB of size.
 ElixirMike
on 12 Aug 2020
ElixirMike
on 12 Aug 2020
@ElixirMike thanks for the feedback! would you be able to privately share a dump of your database and some additional example queries? You can email [email protected]
jberryman
on 12 Aug 2020
Sure, sending over now. Actually, in exporting the data, the actual size is just a bit over 3MB!
ElixirMike
on 12 Aug 2020
@evancorl are you observing a regression when upgrading to 1.2.2? Do those drops in memory usage represent a restart?
Finally, there are quite a few memory-related fixes in the beta pipeline. Please let us know if you find they fix your issue
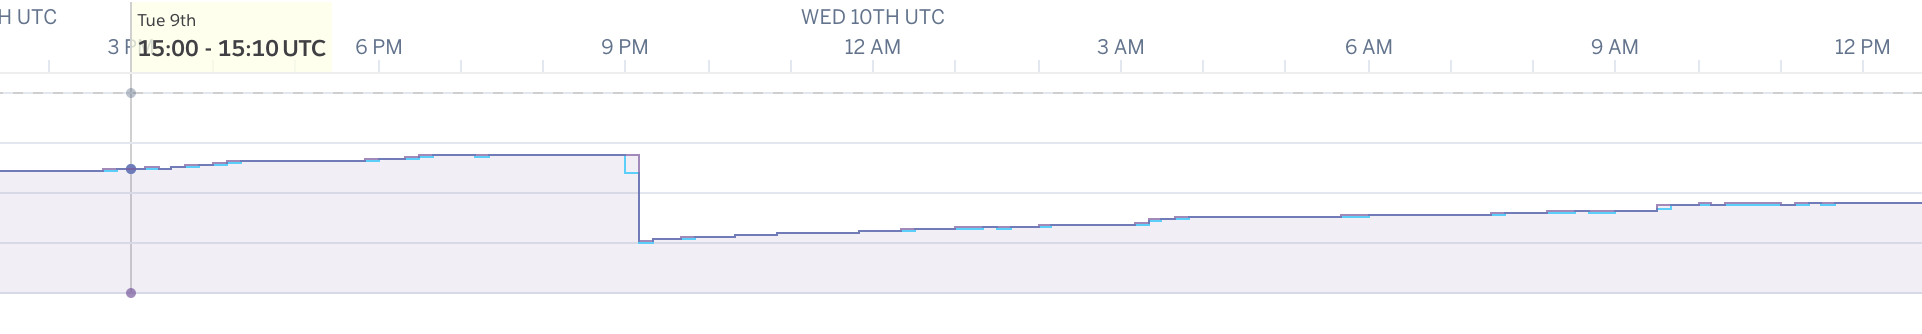
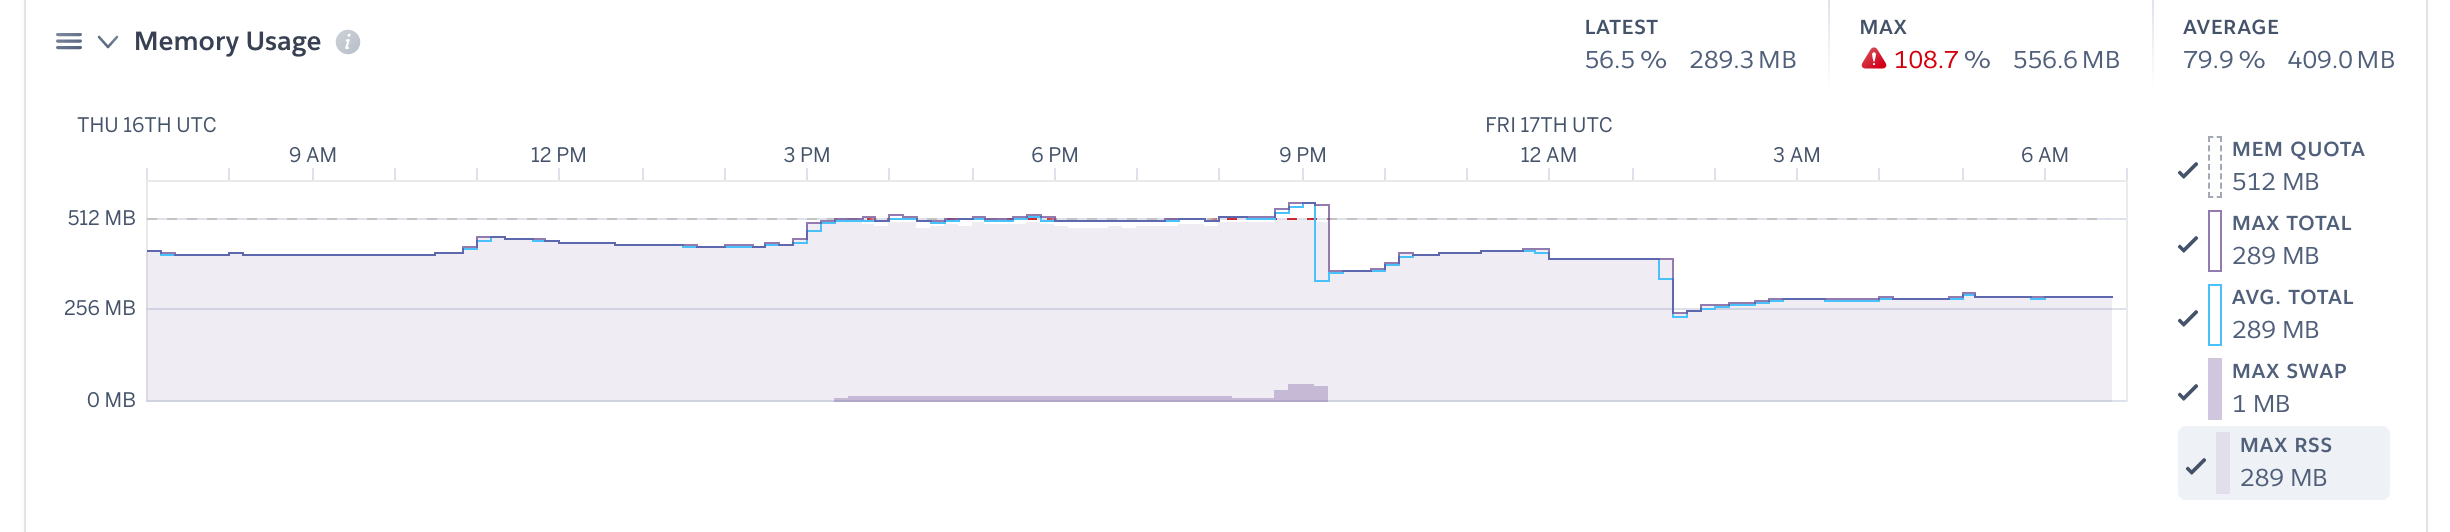
@jberryman Sorry for the late response. We are still experiencing this issue with v1.3.0. I don't remember for certain if the drops from that screenshot represent a restart, but I'm pretty sure they do. Here is a recent example of a user initiated restart:
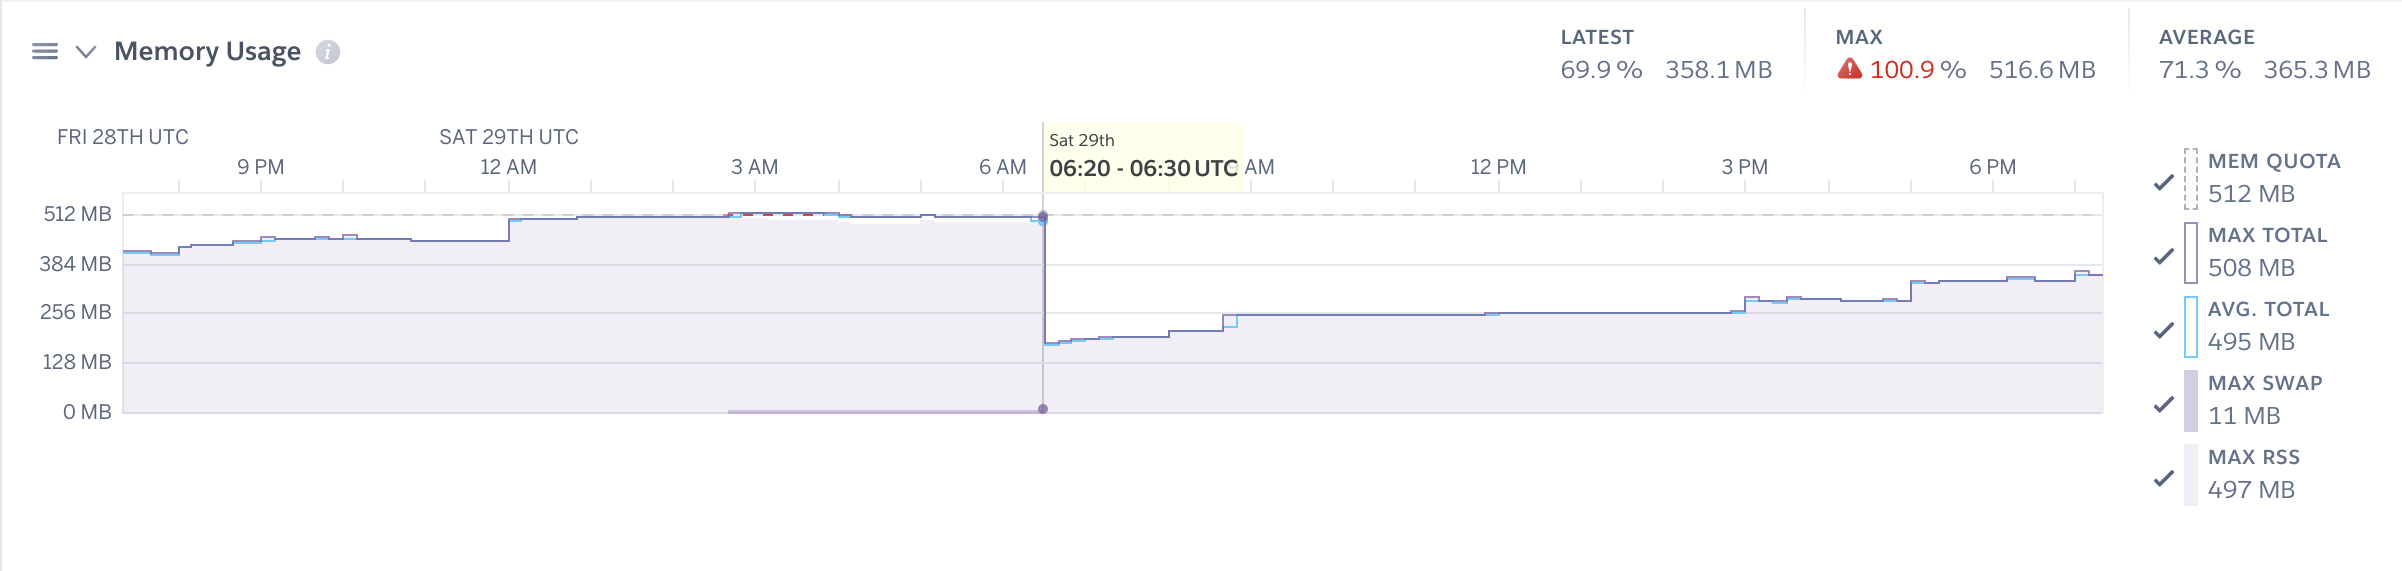
This comment stood out to me, because I'm pretty convinced that the issue has something to do with event triggers. We have quite a few configured for our tables that we rely on to synchronize data with other systems. Our data is growing quickly, and it would not be uncommon for our Hasura server to process 2k - 3k event trigger requests in a single day. There are ways we can reduce the number of processed events, but we can only do so much.
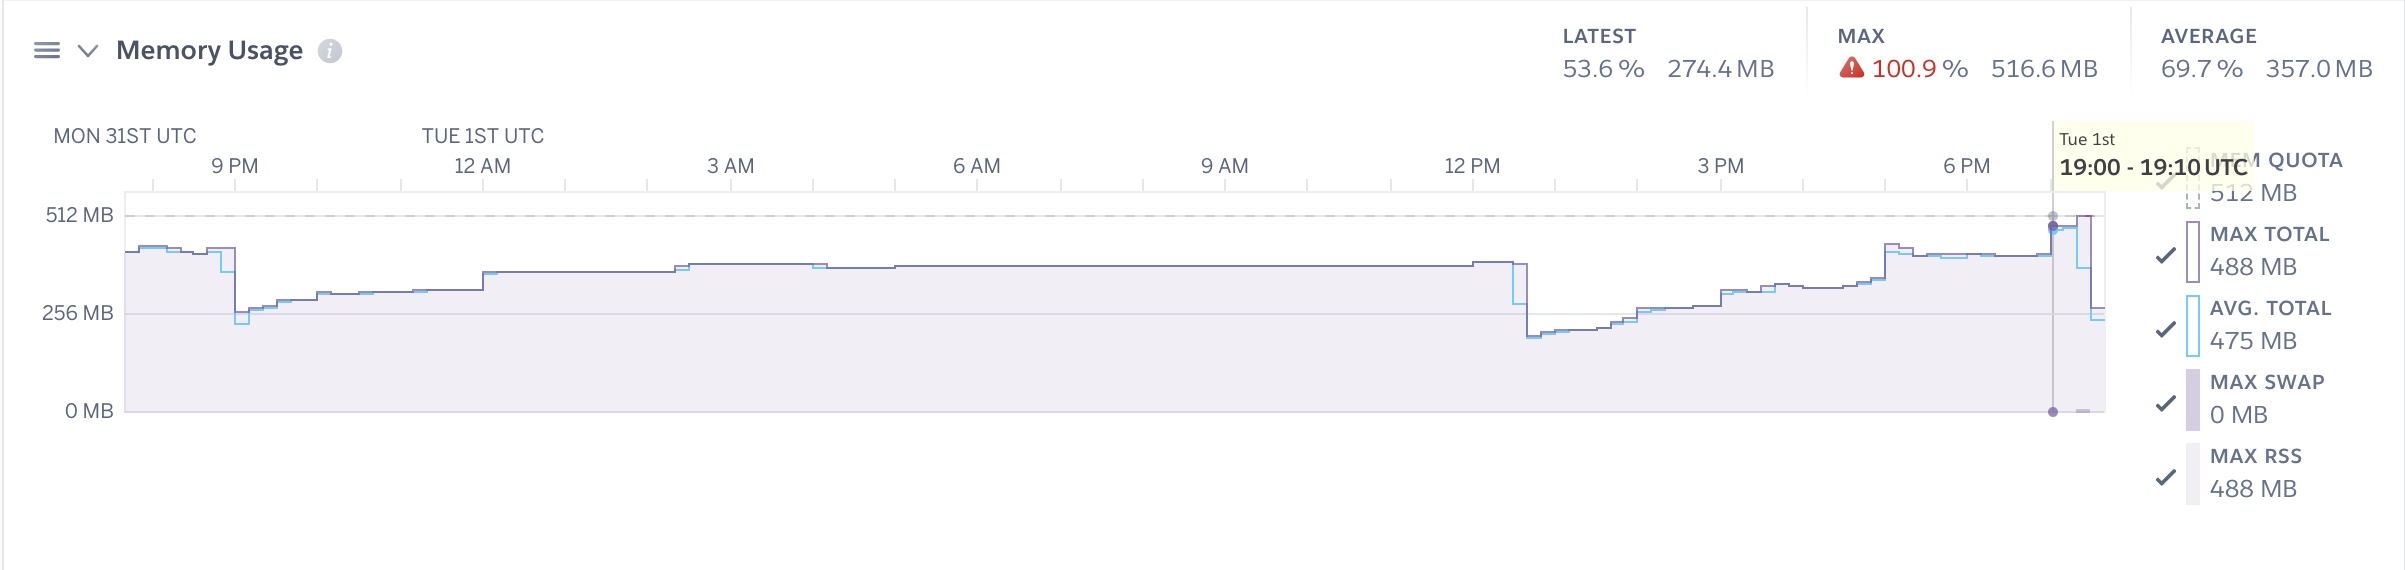
Below is one of the many spikes we see during scheduled cron jobs that insert/update data, which will end up creating a variable amount of event triggers. Strangely, these events seem to rarely error out and are processed quickly. Yet the memory spikes and doesn't ever seem to drop until a daily or user-initiated restart.
Also if you're comfortable sharing your schema and/or data-set and what sorts of queries you're making over direct message that is always helpful.
I'm not sure how comfortable I am sharing our schema. 😅 And our system is making a lot of queries, so it would be hard to narrow it down, but maybe if you have an idea of what I should look for I can let you know.
evancorl
on 10 Sep 2020
@ElixirMike we've put some work into memory usage in the last few months, and it looks to me like the test case you gave us is much improved (>1GB residency vs ~100MB on master for me). Hopefully you find that's the case!
jberryman
on 13 Nov 2020
@jberryman Great to hear! 🙂 Will these improvements be released soon in a new version soon?
evancorl
on 13 Nov 2020
This is a huge issue for me as well, and causes hasura to crash. Whenever there are a lot of event triggers running (my last test had a backlog of 10k events), the memory goes from already high to way too high and everything comes down. I'm running v1.3.3.
I've played with HASURA_GRAPHQL_EVENTS_HTTP_POOL_SIZE to try to combat this. When I had it to the default (100) the service would definitely immediately die as soon as it gets thousands of triggers. I set it down to 25 and the service still stays alive, but as soon as it gets hit with Graphql requests, a significant chunk of them fail and eventually the service dies presumably from memory.
UPDATE: I've given the service a bit more memory, and it seems to work fine now. I was using the GCP App Engine flex default of 0.6gb of memory which was clearly starving the process. I would recommend to the team that you update the setup documentation to recommend a minimum amount of memory wherever you deploy it (each specific guide has some memory recommendations but it's not clear if deploying outside of those guides). Thanks!
 rccoe
on 4 Dec 2020
rccoe
on 4 Dec 2020
Hi guys, any updates about this issue?
 armansaa
on 16 Dec 2020
armansaa
on 16 Dec 2020
Related issues
 coco98
·
3Comments
coco98
·
3Comments
 anisjonischkeit
·
3Comments
anisjonischkeit
·
3Comments
 egislook
·
3Comments
egislook
·
3Comments
 revskill10
·
3Comments
revskill10
·
3Comments
 cpursley
·
3Comments
cpursley
·
3Comments
Most helpful comment
This is a huge issue for me as well, and causes hasura to crash. Whenever there are a lot of event triggers running (my last test had a backlog of 10k events), the memory goes from already high to way too high and everything comes down. I'm running v1.3.3.
I've played with HASURA_GRAPHQL_EVENTS_HTTP_POOL_SIZE to try to combat this. When I had it to the default (100) the service would definitely immediately die as soon as it gets thousands of triggers. I set it down to 25 and the service still stays alive, but as soon as it gets hit with Graphql requests, a significant chunk of them fail and eventually the service dies presumably from memory.
UPDATE: I've given the service a bit more memory, and it seems to work fine now. I was using the GCP App Engine flex default of 0.6gb of memory which was clearly starving the process. I would recommend to the team that you update the setup documentation to recommend a minimum amount of memory wherever you deploy it (each specific guide has some memory recommendations but it's not clear if deploying outside of those guides). Thanks!