Graphql-engine: Very slow select queries (Ignoring Indexing?)
I have a table with 1M rows that has the following index:
psql -U user -d db -c “SELECT * FROM pg_indexes WHERE tablename = ‘messages’;”
schemaname |  tablename  |         indexname         | tablespace |                                          indexdef
------------+-------------+---------------------------+------------+---------------------------------------------------------------------------------------------
public     | messages| updates_timestamp_idx |            | CREATE INDEX updates_timestamp_idx ON public.updates USING btree (“timestamp” DESC)
When I do a select query for the first 10 entries in desc order on the timestamp key on PSQL it runs in 0.039s while hasura takes 4.735s.
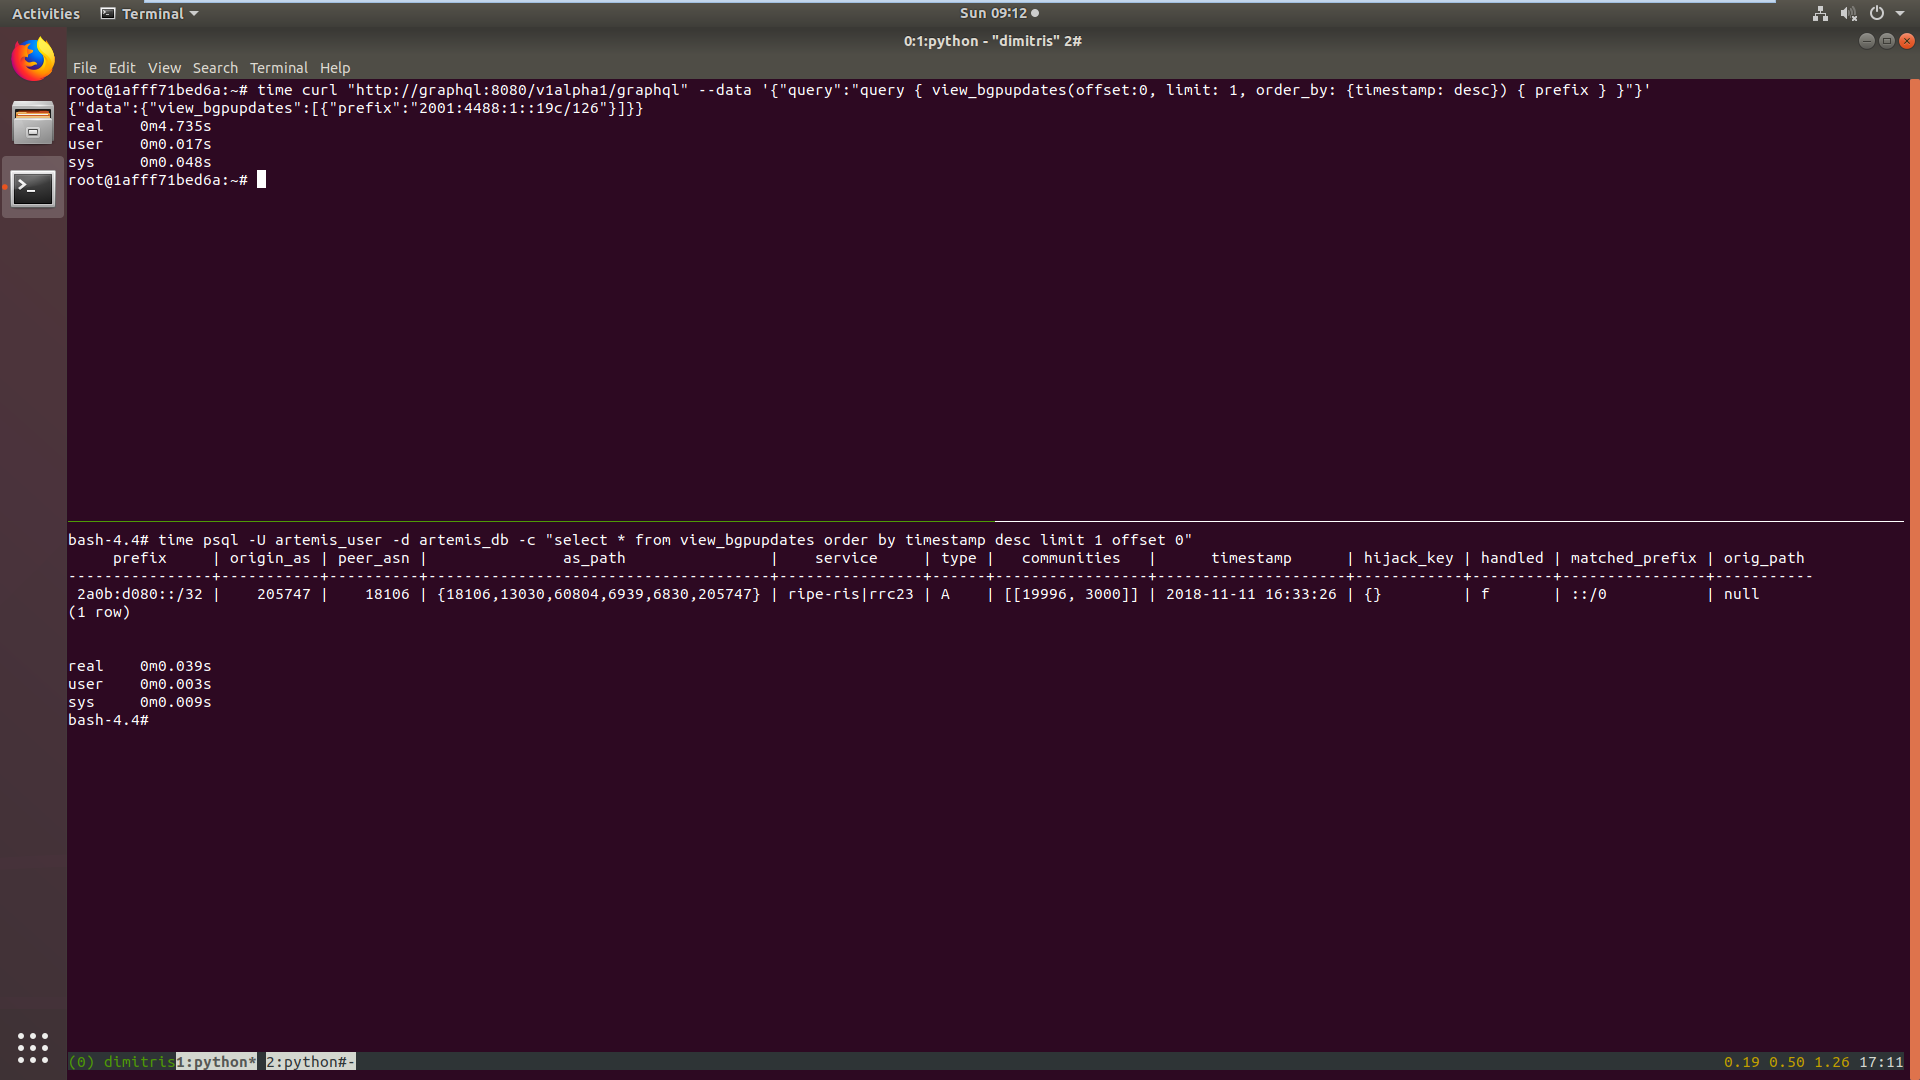
This difference is orders of magnitude bigger. Any idea what's the reason?
P.S. It returns a different result as well. Maybe it doesn't use the indexes at all?
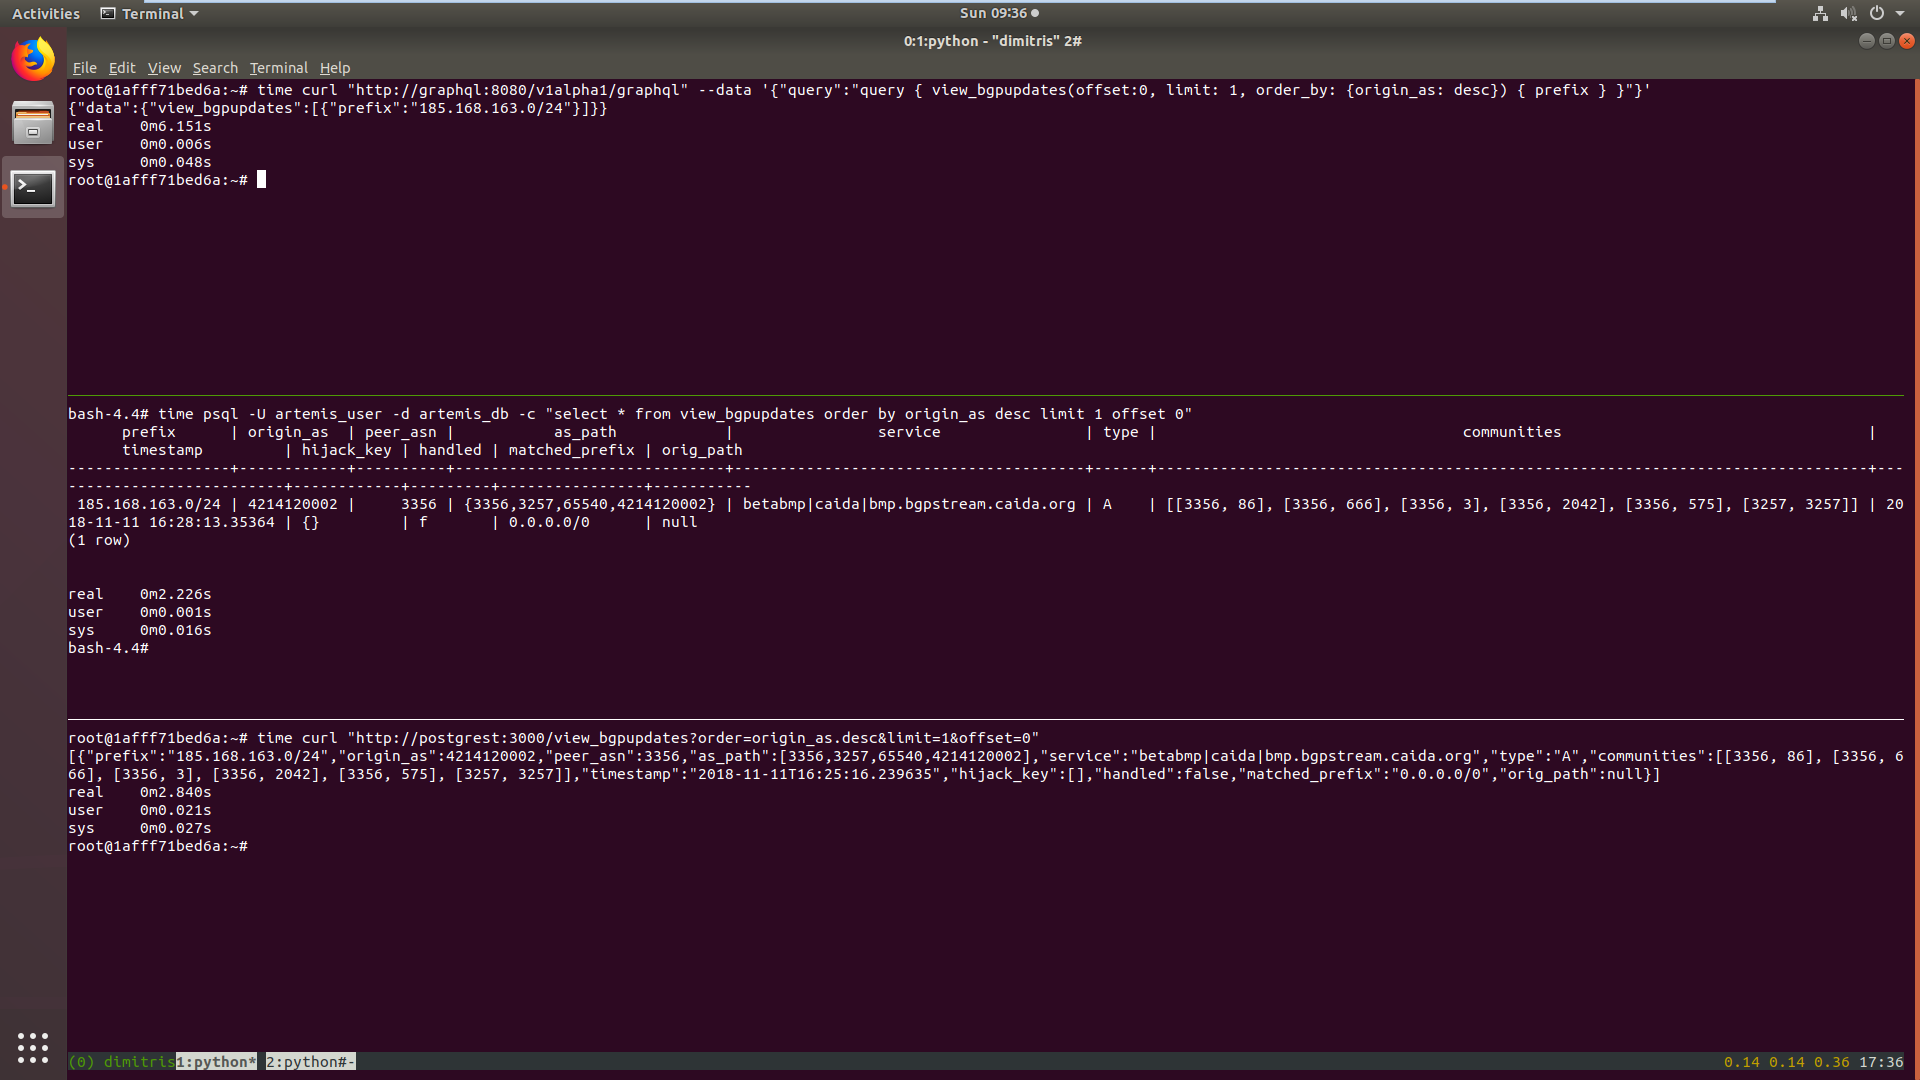
Also, example times from a query on a non indexed column from 1. hasura, 2. psql, 3. postgrest
 slowr
slowr
All 11 comments
upon logging the generated queries I found out that the root of the evil was the NULLS LAST statement that is added in the query. So as suggested in #657 I used the NULLS FIRST approach and the query is working as expected.
Is there a reason that the default is NULLS LAST and this cause the indexes to not be used? Maybe make the _asc and _desc to generate the correct query in order to use the indexes (like NULLS LAST for _asc and NULLS FIRST for _desc, or an enum for no NULLS handling at all)?
slowr
on 11 Nov 2018
@0x777 @slowr
We can change the default to NULLS FIRST but there are 2 considerations:
- Default being
nulls firstseems to be unusual in practice (but that can be worked around by adding a_is_null: falsein thewhereclause) - It might break existing applications :(
Any recommendations?
 coco98
on 11 Nov 2018
coco98
on 11 Nov 2018
@coco98
Even if you change the default to NULLS FIRST then the indexing will stop working for asc ordering (asc still needs NULLS LAST).
Unfortunately,
_is_null: falsedoes not help on this situation and instead it adds an additional filter on the query. The generated query still has theNULLS LASTwhen selecting the fieldsThat's an issue for sure.. that's why I thought maybe you can add an enum that disables the use of
NULLS LAST/NULLS FIRSTon the auto-generated queries. (I am gonna issue a PR for this, to see what I mean)
slowr
on 11 Nov 2018
@slowr @coco98
When it comes to ordering, Postgres considers a NULL value to be larger than any other non-NULL value. So, if the order of the NULLs is not specified, Postgres considers NULLS LAST for ASC and NULLS FIRST for DESC (https://www.postgresql.org/docs/10/queries-order.html).
However in graphql-engine when we decided the defaults for asc and desc it was based on what the fronted typically expects, which is all NULLs in the last. This is a bad default for performance as Postgres can't use the btree index on the column for DESC NULLS LAST.
@coco98 Should we break the api by confirming to Postgres defaults for asc and desc? I'm sure more people will run into this performance problem with desc.
 0x777
on 12 Nov 2018
0x777
on 12 Nov 2018
@0x777
I decided to introduce a new enum to avoid breaking existing deployments. But if you decide to change the default dehavior it might be better in the long term and I can update my PR accordingly.
slowr
on 12 Nov 2018
Please consider adding a section in the docs about optimizations like this so that this kind of info does not remain "out of sight" in the issues.
 theshire-io
on 13 Nov 2018
theshire-io
on 13 Nov 2018
@0x777 @coco98
I just found another issue with your auto-generated queries. I have a table with an index on timestamp and 38251 entries. When I run a query with a small offset the indexes are used correctly:
 Aggregate  (cost=1792.21..1792.22 rows=1 width=32) (actual time=308.116..308.117 rows=1 loops=1)
   ->  Limit  (cost=1790.29..1792.08 rows=10 width=40) (actual time=307.549..307.817 rows=10 loops=1)
         ->  Index Scan Backward using timestamp_index on bgp_updates  (cost=0.29..6847.24 rows=38251 width=40) (actual time=0.427..306.205 rows=10010 loops=1)
               SubPlan 1
                 ->  Result  (cost=0.00..0.02 rows=1 width=32) (actual time=0.002..0.002 rows=1 loops=10010)
 Planning time: 6.362 ms
 Execution time: 308.697 ms
When I use an offset that is above the value of 30669; the indexes are not used:
 Aggregate  (cost=5501.32..5501.33 rows=1 width=32) (actual time=1434.182..1434.183 rows=1 loops=1)
   ->  Limit  (cost=5501.17..5501.20 rows=10 width=40) (actual time=1434.015..1434.029 rows=10 loops=1)
         ->  Sort  (cost=5413.67..5509.30 rows=38251 width=40) (actual time=1397.530..1431.014 rows=35010 loops=1)
               Sort Key: bgp_updates."timestamp" DESC
               Sort Method: external merge  Disk: 13256kB
               ->  Seq Scan on bgp_updates  (cost=0.00..2502.16 rows=38251 width=40) (actual time=0.201..1114.728 rows=38251 loops=1)
                     SubPlan 1
                       ->  Result  (cost=0.00..0.02 rows=1 width=32) (actual time=0.002..0.002 rows=1 loops=38251)
 Planning time: 0.754 ms
 Execution time: 1441.590 ms
The auto-generated query is this one (I removed the NULLS FIRST and LAST to be sure that this is not the problem):
   coalesce(json_agg("root"
ORDER BY
   "root.pg.timestamp" DESC), '[]' ) AS "root"
FROM
   (
      SELECT
         row_to_json((
         SELECT
            "_1_e"
         FROM
            (
               SELECT
                  "_0_root.base"."timestamp" AS "timestamp"
            )
            AS "_1_e" ) ) AS "root",
            "_0_root.base"."timestamp" AS "root.pg.timestamp"
         FROM
            (
               SELECT
                  *
               FROM
                  "public"."view_bgpupdates"
               WHERE
                  (
                     'true'
                  )
            )
            AS "_0_root.base"
         ORDER BY
            "root.pg.timestamp" DESC LIMIT 1 OFFSET $1
   )
   AS "_2_root";
The issue seems to be on your query because when I use POSTGREST there is no issue at all. PostgREST query:
WITH pg_source AS
(
   SELECT
      "public"."view_bgpupdates".*
   FROM
      "public"."view_bgpupdates"
   ORDER BY
      "public"."view_bgpupdates"."timestamp" DESC LIMIT 1 OFFSET 35000
)
SELECT
   null AS total_result_set,
   pg_catalog.count(_postgrest_t) AS page_total,
   array[]::text[] AS header,
   coalesce(json_agg(_postgrest_t), '[]')::character varying AS body
FROM
   (
      SELECT
         *
      FROM
         pg_source
   )
   _postgrest_t;
Analyze result for big offset still uses :
 Aggregate  (cost=5479.62..5479.64 rows=1 width=104) (actual time=41.408..41.408 rows=1 loops=1)
   CTE pg_source
     ->  Limit  (cost=5477.80..5479.37 rows=10 width=194) (actual time=40.883..40.913 rows=10 loops=1)
           ->  Index Scan Backward using timestamp_index on bgp_updates  (cost=0.29..5986.59 rows=38251 width=194) (actual time=0.347..36.849 rows=35010 loops=1)
   ->  CTE Scan on pg_source  (cost=0.00..0.20 rows=10 width=343) (actual time=40.902..40.962 rows=10 loops=1)
 Planning time: 0.838 ms
 Execution time: 41.626 ms
If I change in this query "public"."view_bgpupdates".*to "public"."view_bgpupdates"."timestamp" then it has the same behavior as hasura's query:
 Aggregate  (cost=4640.80..4640.82 rows=1 width=104) (actual time=57.932..57.933 rows=1 loops=1)
   CTE pg_source
     ->  Limit  (cost=4640.52..4640.55 rows=10 width=8) (actual time=57.821..57.829 rows=10 loops=1)
           ->  Sort  (cost=4553.02..4648.65 rows=38251 width=8) (actual time=50.346..54.949 rows=35010 loops=1)
                 Sort Key: bgp_updates."timestamp" DESC
                 Sort Method: quicksort  Memory: 3159kB
                 ->  Seq Scan on bgp_updates  (cost=0.00..1641.51 rows=38251 width=8) (actual time=0.063..21.705 rows=38251 loops=1)
   ->  CTE Scan on pg_source  (cost=0.00..0.20 rows=10 width=8) (actual time=57.830..57.844 rows=10 loops=1)
 Planning time: 0.701 ms
 Execution time: 58.842 ms
No idea why changing the SELECT field changes the behavior of the query for a big OFFSET.
slowr
on 14 Nov 2018
@slowr Let me try to reproduce this.
0x777
on 15 Nov 2018
@slowr I tried to reproduce this but couldn't. From the query that is generated, I'm assuming you are running a query like this?
{
  view_bgpupdates(order_by: {timestamp: desc_nulls_first} limit: 1 offset: 35000) {
    timestamp
  }
}
Are both Postgrest and hasura running against the same database server (the results seems to vary quite a bit for cases where the plans are identical)?
0x777
on 15 Nov 2018
@0x777 Yes I was using the same database and the queries at the same time.
I cleaned everything and tried again and now it works. I don't know what is going on with the planner. Maybe the problem was that I had timescaledb installed (not used for this example though) and somehow that messes up the planner's decision?
slowr
on 15 Nov 2018
@slowr I'm not sure (I'm guessing it has something to do with the total cost of index scan vs sort). In cases like these I wish Postgres gives out all the plans it considered and their costs. By the way you can also use the explain button in GraphiQL to get the generated SQL and its plan. I'm closing this issue in favor of #657.
0x777
on 19 Nov 2018
Related issues
 cpursley
·
3Comments
cpursley
·
3Comments
 stereobooster
·
3Comments
stereobooster
·
3Comments
 revskill10
·
3Comments
revskill10
·
3Comments
 marionschleifer
·
3Comments
marionschleifer
·
3Comments
 rikinsk-zz
·
3Comments
rikinsk-zz
·
3Comments
Most helpful comment
Please consider adding a section in the docs about optimizations like this so that this kind of info does not remain "out of sight" in the issues.