Grafana-zabbix: Text data is not shown in table and single stat panels
Describe the bug
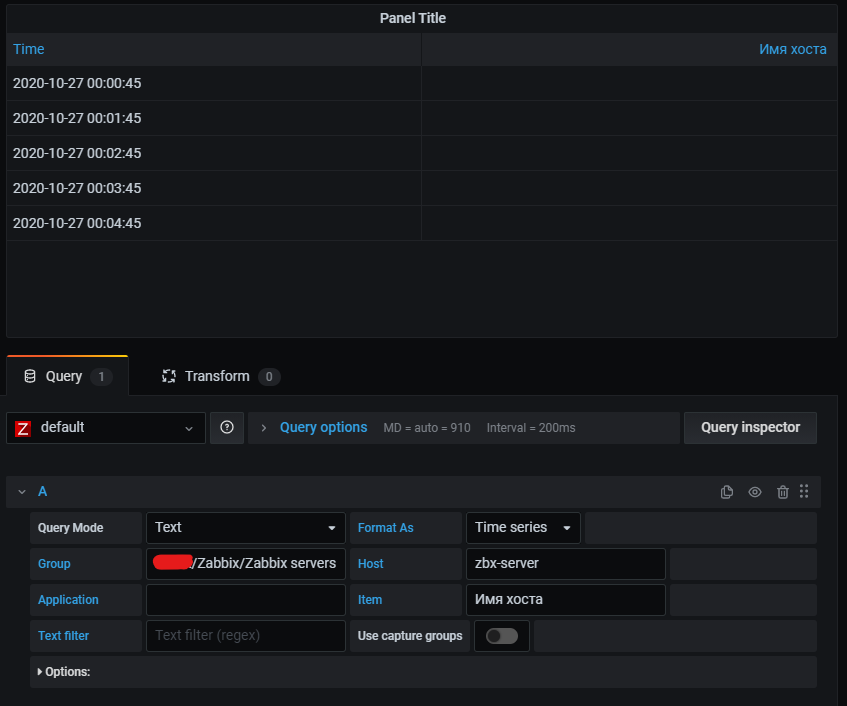
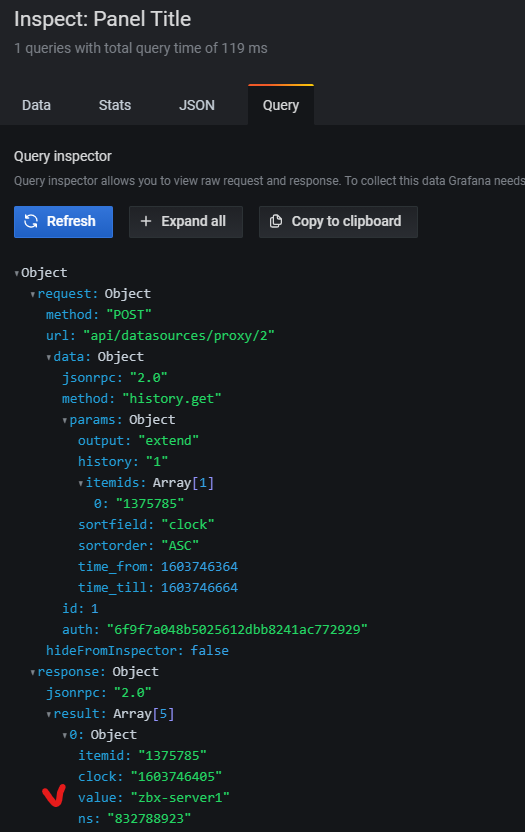
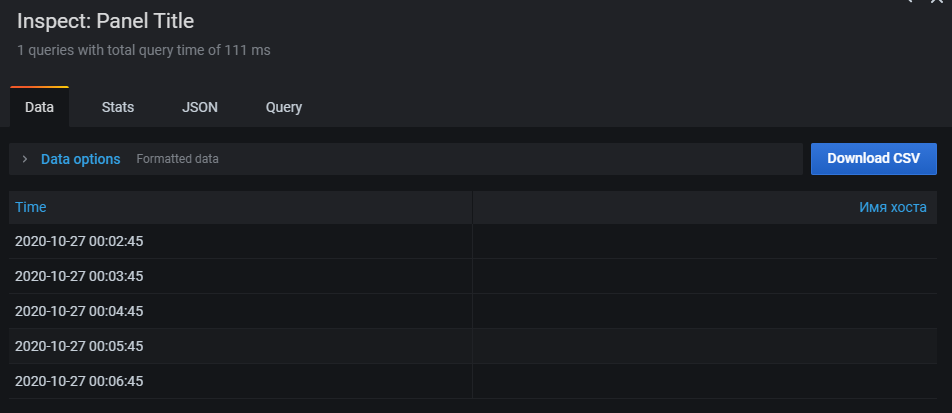
I am trying to show text metric in Grafana Stat and Table panels. Data is now shown.
Expected behavior
Data should be shown.
Screenshots
Software versions
| Grafana | Zabbix | Grafana-Zabbix Plugin |
| ------- | ------ | --------------------- |
| 7.2.2 | 5.0.3 | 4.0.1 |
 vryzhevsky
All 8 comments
it looks like it's Grafana 7.2 fault: #1078
 neothematrix
on 27 Oct 2020
neothematrix
on 27 Oct 2020
Grafana 7.3 is released and the issue keeps then!
 tpramos
on 29 Oct 2020
tpramos
on 29 Oct 2020
Hi,
I have just updated to Grafana v7.3.1 and the problem remains.
Has anyone been fixed?
 juannvalencia
on 30 Oct 2020
juannvalencia
on 30 Oct 2020
Hi,
I have just updated to Grafana v7.3.1 and the problem remains.
Has anyone been fixed?
Yes. Just type any symbol in 'Text filter' field (where you usually write regexp) and then delete that symbol. After that you will see the data in the panel
 mbrekhov
on 31 Oct 2020
mbrekhov
on 31 Oct 2020
Hi,
I have just updated to Grafana v7.3.1 and the problem remains.
Has anyone been fixed?Yes. Just type any symbol in 'Text filter' field (where you usually write regexp) and then delete that symbol. After that you will see the data in the panel
It worked,
Thank you very much!
juannvalencia
on 1 Nov 2020
it looks like it's Grafana 7.2 fault: #1078
It looks like complex bug of Grafana and Zabbix plugin because of this comment - https://github.com/alexanderzobnin/grafana-zabbix/issues/1083#issuecomment-719890044
vryzhevsky
on 9 Nov 2020
Looks like it has been fixed in v4.0.2
https://github.com/alexanderzobnin/grafana-zabbix/releases/tag/v4.0.2
mbrekhov
on 14 Nov 2020
It's fixed now.
 alexanderzobnin
on 23 Dec 2020
alexanderzobnin
on 23 Dec 2020
Related issues
 xiaoxue999
·
3Comments
alexanderzobnin
·
4Comments
xiaoxue999
·
3Comments
alexanderzobnin
·
4Comments
 jameskirsop
·
8Comments
jameskirsop
·
8Comments
 Akabell95
·
8Comments
Akabell95
·
8Comments
 pikaniou
·
7Comments
pikaniou
·
7Comments
Most helpful comment
Yes. Just type any symbol in 'Text filter' field (where you usually write regexp) and then delete that symbol. After that you will see the data in the panel