Graal: Is there any plan for GC improvement?
We have managed to compile sofa-registry meta( https://github.com/sofastack/sofa-registry/tree/master/server/server/meta) into native image, but found GC performance might be the bottleneck of its future implementation.
Expriment setup: -Xmx1024m -Xms1024m -XX:MaximumYoungGenerationSizePercent=80 -XX:PercentTimeInIncrementalCollection=100
The following figure shows the GC overview of the experiment. Application responded 120,000 requests from local machine in 32 minutes. There are 466 GCs in total and 2 of them are Full GCs which are pointed out by data label. The interval between Full GCs is 20 minutes. The light grey and dark grey areas are heap before and after each GC, and the blue line is the time consumed by each GC.
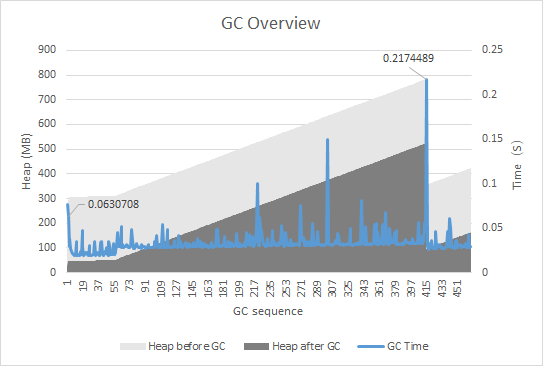
We can see the GC time shakes, and may reach a few peaks which cause serious pauses of request responding.
Is there any tuning policy we can try? Would EE version be better in GC? Or is there any plan to improve GC in the future?
 ziyilin
All 7 comments
Yes, the Native Image GC has much space for improvement and we are working on integrating additional GC algorithms and strategies. There is currently no difference in GC between CE and EE versions.
 cstancu
on 28 Jun 2019
cstancu
on 28 Jun 2019
Good to know that. What are the algorithms and strategies you are working on currently? And do you have any roadmap? Thank you.
ziyilin
on 29 Jun 2019
@ziyilin , you could also try using the EE version with profile guided optimizations. This could lead to less allocations, which in turn will reduce the GCs.
PGO: https://github.com/graalvm/graalvm-demos/tree/master/scala-days-2018/streams#profile-guided-optimizations-with-native-image
 SergejIsbrecht
on 1 Jul 2019
SergejIsbrecht
on 1 Jul 2019
@SergejIsbrecht This would help decreasing GC happenings, but still would not reduce GC time. On the other hand, executation pathes during profiling time may differ from pathes of actual run time. So I think PGO may provide very limited help in GC.
ziyilin
on 2 Jul 2019
How did you come up with the options that you specify for the experiment? For example, -XX:PercentTimeInIncrementalCollection=100 means that full GCs are avoided as long as possible. This means that the old generation fill up more, which in turn can increase the maximum pause times because the heap is larger.
We are working on a low latency GC for EE. For the existing GC, there are several medium-effort improvements that would be possible and could help, for example tenuring in the young generation (which can slow down the filling of the old generation).
 christianwimmer
on 11 Jul 2019
christianwimmer
on 11 Jul 2019
We tried different values to see how application performance was affected by GC. We set -XX:PercentTimeInIncrementalCollection=100 to see what the longest pause would be.
ziyilin
on 12 Jul 2019
I think this can be closed in favor of https://github.com/oracle/graal/issues/2386.
 fniephaus
on 18 Aug 2020
fniephaus
on 18 Aug 2020
Related issues
 sxend
·
3Comments
sxend
·
3Comments
 johanvos
·
3Comments
johanvos
·
3Comments
 ghost
·
3Comments
ghost
·
3Comments
 ilopmar
·
3Comments
ilopmar
·
3Comments
 helloguo
·
3Comments
helloguo
·
3Comments
Most helpful comment
How did you come up with the options that you specify for the experiment? For example,
-XX:PercentTimeInIncrementalCollection=100means that full GCs are avoided as long as possible. This means that the old generation fill up more, which in turn can increase the maximum pause times because the heap is larger.We are working on a low latency GC for EE. For the existing GC, there are several medium-effort improvements that would be possible and could help, for example tenuring in the young generation (which can slow down the filling of the old generation).