Google-play-music-desktop-player-unofficial-: Massive amount of CPU cycles in use
Checklist:
[ ] I have checked that there are no issues with similar or the same content
YOU SHOULD CHECK CLOSED ISSUES ASWELL
- [ ] I have checked the FAQ (https://github.com/MarshallOfSound/Google-Play-Music-Desktop-Player-UNOFFICIAL-/wiki/FAQ) and the answer I am looking for is not there
- [ ] I have double checked and can reproduce the issue
OS:
Mac High Sierra v 10.13.6
GPMDP Version:
4,6,1
Issue Descriptions:
Latest version is using an insane amount of CPU cycles, causing everything else to run slow when in use.
Steps to Reproduce:
Run the software

 pbrooker
All 53 comments
👋 Thanks for opening your first issue here! If you're reporting a 🐞 bug, please make sure you include steps to reproduce it. We get a lot of duplicate issues on this repo, so please double check now that your issue has not already been solved or doesn't have an open issue already.
To help make it easier for us to investigate your issue, please follow the contributing guidelines and ensure the issue template was filled out.
![welcome[bot] picture](https://avatars.githubusercontent.com/in/4141?v=4&s=40) welcome[bot]
on 21 Aug 2018
welcome[bot]
on 21 Aug 2018
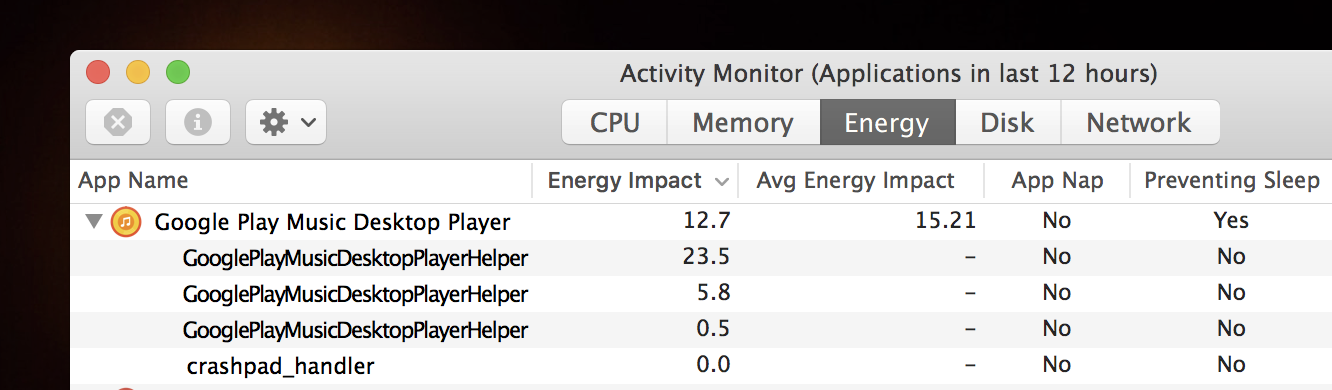
Massive energy usage and heating as well:
 Slaiyer
on 21 Aug 2018
Slaiyer
on 21 Aug 2018
Experiencing this exact same thing.
 jcackowski
on 21 Aug 2018
jcackowski
on 21 Aug 2018
Can confirm I am also experiencing this issue on Ubuntu 18.04. Have had to stop using the app
 bbrcan
on 22 Aug 2018
bbrcan
on 22 Aug 2018
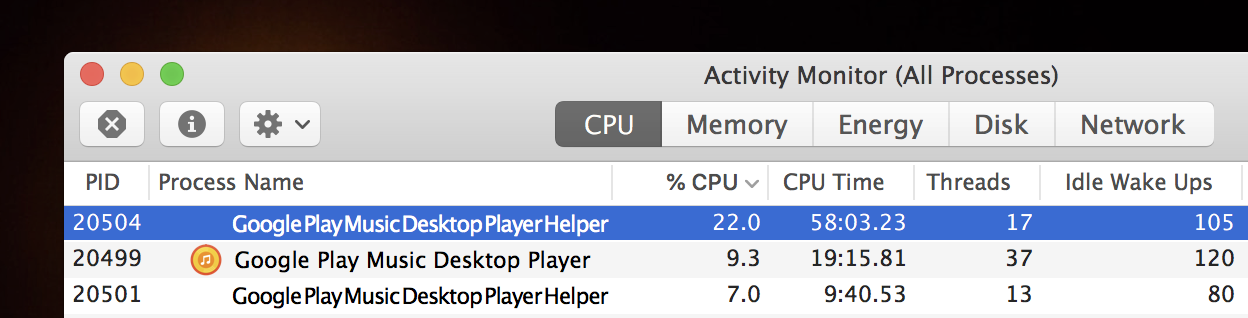
High CPU usage on ubuntu 18.04. Average usage 30%. i7 7700. GPMDP 4.6.1
 alexgred
on 22 Aug 2018
alexgred
on 22 Aug 2018
Ubuntu 18.04, 20-50% cpu on my 3840qm and 10% gpu amd M4000 latest stable
 Deckee
on 23 Aug 2018
Deckee
on 23 Aug 2018
Experiencing this exact same issue as well.
macOS High Sierra 10.13.6
GDMP 4.6.1
 mintiefresh
on 27 Aug 2018
mintiefresh
on 27 Aug 2018
Same on Linux Mint 19 (64bit), constant usage of 20% CPU
i7-2640M
GDMP 4.6.1
Edit (More details):
When I minimize the window, then cpu usage drop to nearly 0%, after restore the window back, CPU usage is again at 20%.
ps auxf (token removed)
weafyr 4929 7.7 2.0 1673096 164584 ? Sl 15:59 0:07 _ /usr/share/google-play-music-desktop-player/Google Play Music Desktop Player
weafyr 4931 0.0 0.5 373536 42120 ? S 15:59 0:00 | _ /usr/share/google-play-music-desktop-player/Google Play Music Desktop Player --type=zygote --no-sandbox
weafyr 4966 11.0 1.3 1084312 107232 ? Sl 15:59 0:10 | _ /usr/share/google-play-music-desktop-player/Google Play Music Desktop Player --type=renderer --enable-experimental-web-platform-features=1 --enable-smooth-scrolling=1 --enable-use-zoom-for-dsf=false --no-sandbox --service-pipe-token=################################ --lang=en-US --app-path=/usr/share/google-play-music-desktop-player/resources/app.asar --node-integration=true --webview-tag=true --no-sandbox --preload=/usr/share/google-play-music-desktop-player/resources/app.asar/build/renderer/generic/index.js --context-id=2 --enable-pinch --num-raster-threads=2 --enable-main-frame-before-activation --content-image-texture-target=0,0,3553;0,1,3553;0,2,3553;0,3,3553;0,4,3553;0,5,3553;0,6,3553;0,7,3553;0,8,3553;0,9,3553;0,10,3553;0,11,3553;0,12,3553;0,13,3553;0,14,3553;0,15,3553;0,16,3553;0,17,3553;1,0,3553;1,1,3553;1,2,3553;1,3,3553;1,4,3553;1,5,3553;1,6,3553;1,7,3553;1,8,3553;1,9,3553;1,10,3553;1,11,3553;1,12,3553;1,13,3553;1,14,3553;1,15,3553;1,16,3553;1,17,3553;2,0,3553;2,1,3553;2,2,3553;2,3,3553;2,4,3553;2,5,3553;2,6,3553;2,7,3553;2,8,3553;2,9,3553;2,10,3553;2,11,3553;2,12,3553;2,13,3553;2,14,3553;2,15,3553;2,16,3553;2,17,3553;3,0,3553;3,1,3553;3,2,3553;3,3,3553;3,4,3553;3,5,3553;3,6,3553;3,7,3553;3,8,3553;3,9,3553;3,10,3553;3,11,3553;3,12,3553;3,13,3553;3,14,3553;3,15,3553;3,16,3553;3,17,3553;4,0,3553;4,1,3553;4,2,3553;4,3,3553;4,4,3553;4,5,3553;4,6,3553;4,7,3553;4,8,3553;4,9,3553;4,10,3553;4,11,3553;4,12,3553;4,13,3553;4,14,3553;4,15,3553;4,16,3553;4,17,3553 --disable-accelerated-video-decode --disable-gpu-compositing --enable-gpu-async-worker-context --service-request-channel-token=################################ --renderer-client-id=3 --shared-files=v8_natives_data:100,v8_snapshot_data:101
weafyr 5029 7.2 2.8 1255692 225784 ? Sl 15:59 0:06 | _ /usr/share/google-play-music-desktop-player/Google Play Music Desktop Player --type=renderer --enable-experimental-web-platform-features=1 --enable-smooth-scrolling=1 --enable-use-zoom-for-dsf=false --no-sandbox --service-pipe-token=################################ --lang=en-US --app-path=/usr/share/google-play-music-desktop-player/resources/app.asar --node-integration=false --webview-tag=true --no-sandbox --preload=/usr/share/google-play-music-desktop-player/resources/app.asar/build/renderer/windows/GPMWebView --guest-instance-id=1 --enable-blink-features --disable-blink-features --context-id=1 --enable-pinch --num-raster-threads=2 --enable-main-frame-before-activation --content-image-texture-target=0,0,3553;0,1,3553;0,2,3553;0,3,3553;0,4,3553;0,5,3553;0,6,3553;0,7,3553;0,8,3553;0,9,3553;0,10,3553;0,11,3553;0,12,3553;0,13,3553;0,14,3553;0,15,3553;0,16,3553;0,17,3553;1,0,3553;1,1,3553;1,2,3553;1,3,3553;1,4,3553;1,5,3553;1,6,3553;1,7,3553;1,8,3553;1,9,3553;1,10,3553;1,11,3553;1,12,3553;1,13,3553;1,14,3553;1,15,3553;1,16,3553;1,17,3553;2,0,3553;2,1,3553;2,2,3553;2,3,3553;2,4,3553;2,5,3553;2,6,3553;2,7,3553;2,8,3553;2,9,3553;2,10,3553;2,11,3553;2,12,3553;2,13,3553;2,14,3553;2,15,3553;2,16,3553;2,17,3553;3,0,3553;3,1,3553;3,2,3553;3,3,3553;3,4,3553;3,5,3553;3,6,3553;3,7,3553;3,8,3553;3,9,3553;3,10,3553;3,11,3553;3,12,3553;3,13,3553;3,14,3553;3,15,3553;3,16,3553;3,17,3553;4,0,3553;4,1,3553;4,2,3553;4,3,3553;4,4,3553;4,5,3553;4,6,3553;4,7,3553;4,8,3553;4,9,3553;4,10,3553;4,11,3553;4,12,3553;4,13,3553;4,14,3553;4,15,3553;4,16,3553;4,17,3553 --disable-accelerated-video-decode --disable-gpu-compositing --enable-gpu-async-worker-context --service-request-channel-token=################################ --renderer-client-id=18 --shared-files=v8_natives_data:100,v8_snapshot_data:101
 Weafyr
on 29 Aug 2018
Weafyr
on 29 Aug 2018
Same issue here with macOs HighSierra 10.13.6. Have to wait a little while before noticing the lag.
 oms064
on 2 Sep 2018
oms064
on 2 Sep 2018
Confirming.
OS: High Sierra 10.13.6
GPMDP version: 4.6.1
 theLastOfCats
on 4 Sep 2018
theLastOfCats
on 4 Sep 2018
Same issue on OSX OS: High Sierra 10.13.4
 inkubux
on 5 Sep 2018
inkubux
on 5 Sep 2018
Also experiencing on OSX, only started recently
 ellman121
on 6 Sep 2018
ellman121
on 6 Sep 2018
CPU usage hovers around 30% (OSX 10.11.6)
 j3g
on 17 Sep 2018
j3g
on 17 Sep 2018
Confirming. MacOS Mojave 10.14
 alexriabtsev
on 25 Sep 2018
alexriabtsev
on 25 Sep 2018
confirm. mac os mojave 10.14
P.S. Disabling Discord Rich Presence solved the problem
 maxim-vorotilo
on 27 Sep 2018
maxim-vorotilo
on 27 Sep 2018
I have the same high CPU and do not have Discord Rich Presence enabled.
Fedora 28
 djfjeff
on 28 Sep 2018
djfjeff
on 28 Sep 2018
Confirming. macOS 10.14.
I never used Discord Rich Presence.
Just after opened the application without any song playing the CPU usage is around 12% to 15%.
 felipemlemos
on 13 Oct 2018
felipemlemos
on 13 Oct 2018
Same issue on Pop_OS (essentially Ubuntu 18 LTS)
High CPU and (thankfully stable at 2.1 GB) RAM usage, mitigated it by setting process priority to low, but it's still someone noticeable in how rapidly it responds to control input (even before lowering priority)
 Minothor
on 15 Oct 2018
Minothor
on 15 Oct 2018
Similar problems here on Ubuntu 18.04. If I minimize the app to the tray, CPU is reasonable, but if I have the player showing at all, even in the mini player, I end up with two processes that hover around 15-20% CPU utilization.
 bmoyles
on 29 Oct 2018
bmoyles
on 29 Oct 2018
Just installed this on Windows 7 and had to uninstall within about 15 minutes, almost unusable because of the amount of resources it uses.
 Dan33185
on 4 Nov 2018
Dan33185
on 4 Nov 2018
On Ubuntu 18.04, issue occurs when the main app window is open, playing in the background with the tray player, CPU usage is normal.
 aditsachde
on 11 Nov 2018
aditsachde
on 11 Nov 2018
Any response from the Dev yet?
Dan33185
on 11 Nov 2018
Same issue. On macOS mojave over 100% CPU ussage and over 6GB virtual memory ussage
 kazak1377
on 27 Nov 2018
kazak1377
on 27 Nov 2018
Can also confirm. macOS 10.14.1 and GPMPD 4.6.1. The program is borderline unusable in its current state. Would love to see this resolved.
 AlexMorrisonDev716
on 27 Nov 2018
AlexMorrisonDev716
on 27 Nov 2018
I've had this for some time, and it's in the latest version 4.6.1 too. It starts right away, even before playing the first song. Fresh Debian sid on x86_64.
All I can see is that it's one of the two "Google Play Mus" threads that's busy looping. Attaching ~10s of "strace -r" log FWIW, but it just shows futexes being woken and not waited upon.
 marstj
on 29 Nov 2018
marstj
on 29 Nov 2018
By the way problem is not in Discord integration. I've turned it off and app stills producing several processes in total amount of 100% CPU ussage
kazak1377
on 29 Nov 2018
It used to take quite a bit of CPU in Chrome as well but in v70 Google Play Music is only taking 2-6% when the window is minimized.
The Desktop app is nicer, but I can't afford the extra CPU so I made this applescript to toggle the player window, and I trigger it with Quicksilver:
Toggle Google Play Music.scpt:
tell application "Google Chrome"
    if frontmost then
        set w to window 1
        if visible of w is true and (URL of active tab of w) contains "music/listen" then
            -- Chrome uses minimized instead of miniaturized
            set minimized of w to true
            return
        end if
    end if
    activate
    set i to 0
    repeat with w in (windows)
        set i to i + 1
        set j to 0
        repeat with t in (tabs of w)
            set j to j + 1
            if URL of t contains "music/listen" then
                set (active tab index of w) to j
                set index of w to 1
                tell application "System Events" to tell process "Google Chrome"
                    perform action "AXRaise" of window 1 -- `set index` doesn't always raise the window
                    -- keystroke "f" using {option down, command down}
                end tell
                return
            end if
        end repeat
    end repeat
    activate
    open location "https://play.google.com/music/listen"
end tell
 wmertens
on 4 Dec 2018
wmertens
on 4 Dec 2018
Can confirm on macOS Mojave 10.14.2 I see 3 processes with ~100% cpu, ~13%, %5 respectively.
Player is minimized.
 chuckmitchell
on 6 Dec 2018
chuckmitchell
on 6 Dec 2018
Can confirm this on Fedora 29 as well.
LSB Version:    :core-4.1-amd64:core-4.1-noarch:cxx-4.1-amd64:cxx-4.1-noarch:desktop-4.1-amd64:desktop-4.1-noarch:languages-4.1-amd64:languages-4.1-noarch:printing-4.1-amd64:printing-4.1-noarch
Distributor ID: Fedora
Description:    Fedora release 29 (Twenty Nine)
Release:    29
Codename:   TwentyNine
Linux 4.19.5-300.fc29.x86_64 #1 SMP Tue Nov 27 19:29:23 UTC 2018 x86_64 x86_64 x86_64 GNU/Linux
CPU usage is unbearable and grinds machine to a halt on a modern quad-core laptop, even when it's not playing any music, so I've had to uninstall.
Will be watching this threads in the hope that it goes fixed soon, as it is such a good application.
 px4n
on 6 Dec 2018
px4n
on 6 Dec 2018
This seems to be a dead project, there hasn't been a response by the developer or a new release in 5 months.
Dan33185
on 6 Dec 2018
His Github is active, I wonder if reaching out to him to understand current status is in order.
@MarshallOfSound sorry to highlight was wondering on the status of this project?
Let us know if we need to open a new issue to discuss.
px4n
on 6 Dec 2018
I know you all are eagerly waiting performance enhancements, and there are definitely some to be made. I've done a little digging and I see quite a few points in the code which could be optimized to hopefully reduce CPU usage, especially at idle.
On the main window (the frame around GPM and YTM) there is the loading screen rendering in the background, 100% of the time, even after the service is loaded:
This should be a quick easy fix to eliminate a lot of CPU usage off the top of this process.
I don't see any immediate issues with the injected code in GPM, however with the addition of YTM there are a quite a few things that need to be adapted and fixed so that YTM isn't using as much CPU.
As far as the project status goes, it's a side project. There may be times when the releases aren't going out very often and commits are lacking, but when we get free time we try to fix and add enhancements. In my free time I'll see if I can fix the CPU leaks I've found and commit them.
 jostrander
on 6 Dec 2018
jostrander
on 6 Dec 2018
Hi @jostrander ,
Thanks for the swift reply and quick digging that you've done around the issue, it is appreciated!
I believe most understand that this is a side-project (as with most OSS projects out there), and are very grateful for this (I know I am) :100:
I believe clarification is wanted on whether or not the project is dead or needs developer assistance.
If that is made clear, I'm pretty sure there will be others that will come forward to assist and/or take-over as needed.
I see that you are a collaborator, so am I right in assuming that your response means the project is not dead however could do with some help from the community?
px4n
on 6 Dec 2018
Community help is always appreciated, and no, I wouldn't consider it a dead project :+1:
jostrander
on 6 Dec 2018
Thanks for clarifying!
I might start looking under the hood as I get time (unfortunately JavaScript is not my first language), but let me know if there is anything I can do to assist (testing, etc.).
px4n
on 6 Dec 2018
@px4n @Dan33185 I feel like I should clarify a few things here.
- This project is definitely not dead and something to be aware of, I find it quite insulting when one of my projects is called dead. A project is declared dead / abandoned by its maintainers, not onlookers in GitHub issues.
On a brighter note:
- I don't have a significant amount of time nowadays to fix bugs / do things with this player. If some community members want to step up to the plate and start landing stuff in PRs I'm 💯% on board with that and as with all my projects will gladly carve time out of my day to review those pull requests.
If any folks have questions about the layout of the code, ask away, if anyone wants to refactor half the app, go for it. Please be aware that half the code here at least was written like 3+ years ago 😆 .
TLDR: Come help all ye' who want to help 😄
 MarshallOfSound
on 8 Dec 2018
MarshallOfSound
on 8 Dec 2018
Hey @MarshallOfSound ,
Thanks for taking the time to reply.
In regards to point one, I haven't specifically called the project dead, if anything all that has been done is a reach out for clarification on if the project is still alive or not and/or if assistance was needed.
Which I think is a reasonable question, seeing as there hasn't been a response on this thread from any of the maintainers since this issue was created, nor has there been any code commits or releases in a while, so there should be nothing insulting in reaching out for clarification here, even if I am an _onlooker_ ;).
That being said, I've been slowly going over the code the last two days, to understand and eventually be able to debug this CPU issue, in case I have any questions what is a good way to get in touch?
px4n
on 8 Dec 2018
@px4n I'm not that active in Gitter nowadays so you're best bet tbh is to do the old fashioned thing and email me. Also if you put up just WIP PR's and ask for clarification on those I can respond there.
MarshallOfSound
on 9 Dec 2018
I don't know what they do differently , but I found a simple electron google play app that uses 3%-7% instead of 30% on my macbook.
https://github.com/pmsaue0/play
The app is not configurable as this one but it's an alternative for now
inkubux
on 19 Dec 2018
@inkubux thank for your suggestion. But this app cant be controlled via media keys and dont support now playing. Waiting for fix GPMDP.
kazak1377
on 19 Dec 2018
I checked out master and applied @jostrander 's fixes in #3441 but they didn't seem to help much.
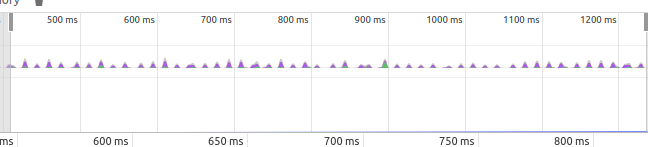
I opened dev tools, closed the main window, and started the CPU profiler. I let it run for ~ 25s, clicked a bit in the tray menu, and then restored the main window. For the last ~5-10s I had the main window visible and moved my mouse around a bit in the window.
Gzipped profile is attached, looks to be some React foo (my JS is weak at best). Once the main window is visible, a batchedUpdates call seems to fire every 20ms or so, occasionally handling SyntheticMouseEvents
It's immediately obvious from the flame graph view when I restore the main window, should make it easy to drill down if you should load the profile yourself.
bmoyles-gpmdp.cpuprofile.gz
bmoyles
on 21 Dec 2018
Did a bit more digging, and near as I can tell, despite #3441 hiding the loader, it continues to animate, so I stopped the animation via the console. Better, but I noticed that its very presence of the loader SVG was still causing layout recalculations. So, again via the console, I removed the SVG and CPU seems normal again
bmoyles
on 21 Dec 2018
That's completely different from the profiling I get currently. Do you have lyric scrolling enabled?
jostrander
on 21 Dec 2018
@jostrander I take it back, I applied the fix from #3441 but didn't have yarn watch running or do a yarn build. Sigh.
So #3441 definitely seems to make a significant improvement, SVG isn't causing any problems with that fix in place.
There is still a decent spike in CPU if the main window has focus and the mouse cursor is moving, though. Attached is a fresh profile from the Performance tab of the dev tools. Roughly 5 seconds with window un-focused, then I switch to the main window and move my mouse around in an empty section for ~10s, and then I remove focus from the main window for the remaining 5s. While mouse is moving, react appears to dispatch every 20ms, followed by painting/compositing/etc. While this is happening, the two render processes and the main process jump to 20-35% CPU. Whether or not this behavior existed prior to 4.6.1 I can't say.
bmoyles
on 21 Dec 2018
bmoyles-gpmdp-profile.json.gz
Forgot attachment.
bmoyles
on 21 Dec 2018
Although I use it through Flatpak's flathub/com.googleplaymusicdesktopplayer.GPMDP on KDE neon, it's still issue on my system too. I have to note, allegedly Flathub version contains the latest version.
https://github.com/flathub/com.googleplaymusicdesktopplayer.GPMDP
https://github.com/flathub/com.googleplaymusicdesktopplayer.GPMDP/issues/13
 aldevel
on 28 Dec 2018
aldevel
on 28 Dec 2018
4.6.1 still no fix
kazak1377
on 9 Jan 2019
@kazak1377 gdpmp hasn't been updated since this issue was opened 🙄
 theLMGN
on 13 Jan 2019
theLMGN
on 13 Jan 2019
@bmoyles while I don't have any evidence on hand, I do not think this behavior is limited to 4.6.1, I've notice what seems like 'extreme' resources usage, since I started using this app almost two years ago. Primarily notice this on Windows, don't use the OS X nearly as often.
 dmillerzx
on 14 Jan 2019
dmillerzx
on 14 Jan 2019
Is there a plan on updating GDPMP in the near future? I love how it works but specifically this issue is a pretty big problem for me.
 chrisspiegl
on 19 Jan 2019
chrisspiegl
on 19 Jan 2019
I notice that out of 4 cores on my CPU one of them is always at 100% when this application is open, plus its using 2GB of ram! Its way to much ram to be reasonable.
 tankerkiller125
on 7 Feb 2019
tankerkiller125
on 7 Feb 2019
+1 Here, Windows 10. GPMDP 4.6.1 (installed via Chocolately.) With main window open (On home or library, not playing or anything,) doesn't have to be active, bounces between 1-8% CPU. (Meanwhile, Chrome w/ 37 tabs is c. 1.5%). Minimize window, drops to 0.
 OranguTech
on 24 Mar 2019
OranguTech
on 24 Mar 2019
Gonna close this out as significantly improved by #3441
MarshallOfSound
on 23 Apr 2019
Related issues
 logictom
·
4Comments
logictom
·
4Comments
 Gimbergsson
·
3Comments
Gimbergsson
·
3Comments
 xnaas
·
4Comments
xnaas
·
4Comments
 EzraLopez
·
4Comments
EzraLopez
·
4Comments
 greghesp
·
3Comments
greghesp
·
3Comments
Most helpful comment
Experiencing this exact same thing.