Google-cloud-ruby: Pub/Sub subscriber stops processing messages
I'm pretty sure I'm having the same problems described in https://github.com/googleapis/google-cloud-ruby/issues/2011. Didn't want to reopen that issue, apologies if it wasn't the right decision.
I run a very simple ruby consumer where I:
- Setup a
Subscriberand callstarton it. - Boot another thread where I start a basic rack http server to expose some custom prometheus metrics.
- Start an endless loop where I print some stuff every few seconds.
I observe that sometimes it just stops processing messages. For instance, you can see a couple pods where CPU usage just decreases for no reason while others keep going:

The http thread keeps working, and when the pod stops (because of autoscaling or whatever) it shuts down cleanly.
I added an autoscaler based on CPU a week ago, and that seemed to help, but after a week I see the same behavior. Before the autoscaler they would almost always get stuck unless I ran more consumers than I needed.
My questions, I guess:
- Any idea why this is happening? Could something internal to the pubsub gem be crashing in a way that doesn't raise anything? I've worked with ruby a long time and threads still make me shudder.
- Any way we could cleanly detect if this happens? Would calling
Subscriber#stopped?let us know if things have stopped processing?
I would rather not rely on "have messages been processed in the last N seconds" to know if a consumer is working fine, because we run all kinds of consumers in all kinds of environments (like staging) where I'm not sure if there's going to be a solid amount of messages coming in.
Thanks a lot!
 mrsimo
All 63 comments
Thanks for the issue. I have some questions to help us understand your environment.. What gem version are you using? What Ruby version? What platform? What other settings are being used on the subscriber? Are there any errors sent to on_error that coincide with the messages stopping?
 blowmage
on 24 May 2019
blowmage
on 24 May 2019
Ah, yes, I should have sent these from the beginning.
I'm using google-cloud-pubsub 0.35.0. Ruby version:
$ ruby -v
ruby 2.5.3p105 (2018-10-18 revision 65156) [x86_64-linux]
It runs in a container built with FROM ruby:2.5-slim having installed only the build-essential package with apt.
I'm passing these to the Subscription#listen method:
{
  streams: 1,
  inventory: 250,
  threads: {
    callback: 2,
    push: 1
  }
}
These settings I had tweaked long time ago because I preferred running more smaller pods rather than have a lot of threads. I can return it back to the defaults and run the consumers for a while, if it helps.
I'm not defining an on_error. This is a simplified version of what I'm running:
subscriber = subscription.listen(PUBSUB_SUBSCRIBER_OPTIONS) do |received_message|
  handle_and_acknowledge(received_message)
end

def handle_and_acknowledge(received_message)
  # process the message
rescue => error
  Bugsnag.notify(error)
ensure
  received_message.acknowledge!
end
Would you recommend I define an on_error instead of that specific handle_and_acknowledge method that rescues?
Thanks for your help, @blowmage!
mrsimo
on 24 May 2019
The error handling you have will log errors in your logic, but not errors that are raised on the Subscriber. Subscriber attempts to recover from errors, so it would be advantageous to know what was happening on the background threads.
subscriber = subscription.listen(PUBSUB_SUBSCRIBER_OPTIONS) do |received_message|
  handle_and_acknowledge(received_message)
end
subscriber.on_error do |error|
  # log errors raised on the subscriber
  Bugsnag.notify(error)
end
subscriber.start
How often are you seeing this behavior? Is it every time? Or is it intermittent?
blowmage
on 24 May 2019
@blowmage it feels like the more "busy" a process is, the more likely it is to happen. Like, before I added autoscaling, on peak time sometimes we would hit a threshold (in rate of messages) that I knew would make the amount of deployed consumers not be able to keep up. In those situations, with the consumer working at full speed, it seemed very likely to happen. But I didn't experiment with that for long.
I'll add the on_error handler and see if something pops up! Thanks a lot for the recommendation!
mrsimo
on 24 May 2019
Just wanted to say that I've been running the updated version with the added on_error that notifies Bugsnag since Monday, and hasn't happened yet. I'll try to force stressing one of these to see if I can trigger it.
mrsimo
on 30 May 2019
Wonderful, thanks for following up with us. I've been digging into the implementation, and while we don't have a reproduction yet, and I don't see anything that would be causing this, I do think I've got some ideas on how to make it more resilient to unexpected errors. Looking forward to seeing what you can find.
blowmage
on 30 May 2019
With yesterday's fun this happened again... even though we were pretty much at the lowest rate of messages per second.
In the logs for that pod there was an error (caught by my own rescue inside the listen block, not by the on_error, otherwise the log entry would say something different), and ~22s later it seems to stop. A couple hours later I force the pod to shut down (so I get a new one).
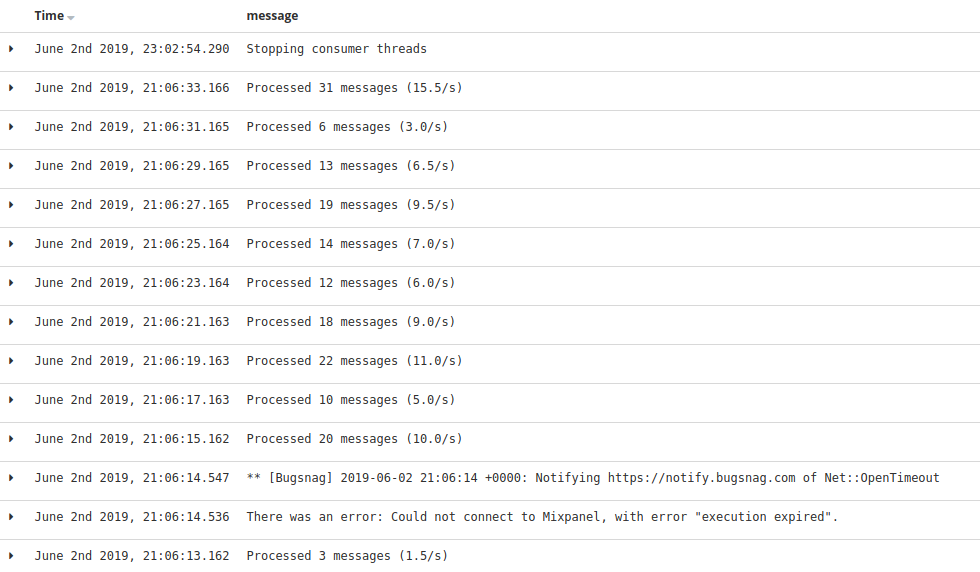
At the time it wasn't breaking much of a sweat:

It didn't seem related to an error caught by a simple rescue in the listen block or an on_error block. The on_error has been catching errors this last week, so I think I added it correctly. It's caught mainly Google::Cloud::UnavailableError and Google::Cloud::DeadlineExceededError.
mrsimo
on 3 Jun 2019
The network timeout is interesting. Where is this running? If it is on GCP how are you configuring authentication? Specifically, are you providing a JSON keyfile? Or are you using the default environment authentication lookup?
I wonder if the auth token wasn’t able to refresh due to a network failure might cause this behavior. That might cause the inventory of pending messages to fill and then just wait until it was reduced.
blowmage
on 3 Jun 2019
There was a major Google wide (including Cloud) outage yesterday. There wasn't much that the client could have done in that situation.
 sduskis
on 3 Jun 2019
sduskis
on 3 Jun 2019
LOL, I wondered what “yesterday’s fun” meant. I was on the road all day yesterday, and got back late last night.
blowmage
on 3 Jun 2019
@blowmage this is running in GKE, so yes, in GCP. Authentication happens through a service account key that I pass via ENV variable. This service account has roles/pubsub.subscriber and roles/pubsub.viewer roles. We're not relying on the default environment authentication stuff.
If I understand things correctly, the way google-cloud-pubsub is intended to be used on the subscriber side of things is by:
- Instantiate a
Subscriberby callingSubscription#listen. - Make sure you call
acknowledge!on each message, inside thelistenblock. - Call
Subscriber#start. - Sleep indefinitely?
Calling Subscriber#start doesn't block, which I guess is intentional. Is it expected that it will always and forever be working, doing as many retries as necessary doesn't matter how many timeouts or errors happen in the various threads?
Is there some way I can ask the Subscriber if it's healthy? Whatever is happening to these pods, it seems pretty clear to me that something is crashing somewhere. But because these are all just background threads, my endless loop just keeps on loopin'. It would be great if I could check in each loop if Subscriber#healthy? or similar. I mean, there's Subscriber#stopped? but I'm not sure if that will be true when things crash down, or only when I call stop on it.
Also, is there anything that would aid you in figuring this out? I can add some monitoring on other stuff... like number of threads? Or is there something I could inspect on the Subscriber that would help us see how it's doing? At this point I'd be pretty happy if I could implement my own Subscriber#healthy? so I can have a liveness probe to have k8s restart unhealthy pods.
Thanks a lot!
mrsimo
on 4 Jun 2019
You could log the grpc client to see if that shows you anything. Has it hung again, besides the Goggle outage?
blowmage
on 4 Jun 2019
You could log the grpc client to see if that shows you anything
I tried adding the gRPC logging locally, but it's really quite verbose. I'll do that if I can find a way to reproduce this more easily.
Has it hung again, besides the Goggle outage?
It doesn't happen often, and with the autoscaler even less, so no, it hasn't hung again. But nothing has changed since the initial occurrences I reported, so I don't think it has been fixed yet.
mrsimo
on 4 Jun 2019
But nothing has changed since the initial occurrences I reported, so I don't think it has been fixed yet.
Correct. I am hoping that we get something helpful sent to on_error before it hangs for a reason other than Google Cloud going down. :)
blowmage
on 4 Jun 2019
Chiming in here, we're seeing the same thing as well. For our application we boot in a Rake process that starts several subscribers. After a while one of them stop receiving messages entirely. We're doing the almost exact same thing where we rescue and report to bugsnag:
subscription = topic.subscription subscription

subscriber = subscription.listen do |message|
  sleep 1
  begin
    ActiveRecord::Base.connection_pool.with_connection do
      block.call(message)
    end
  rescue Exception => e
    Rails.logger.error e.inspect
    Rails.logger.error e.backtrace.join("\n")
    Bugsnag.notify(e)
  end
end

subscriber.start
This is our graph of unack'd messages. The huge drops are deploys which kick the pod in our GKE cluster.
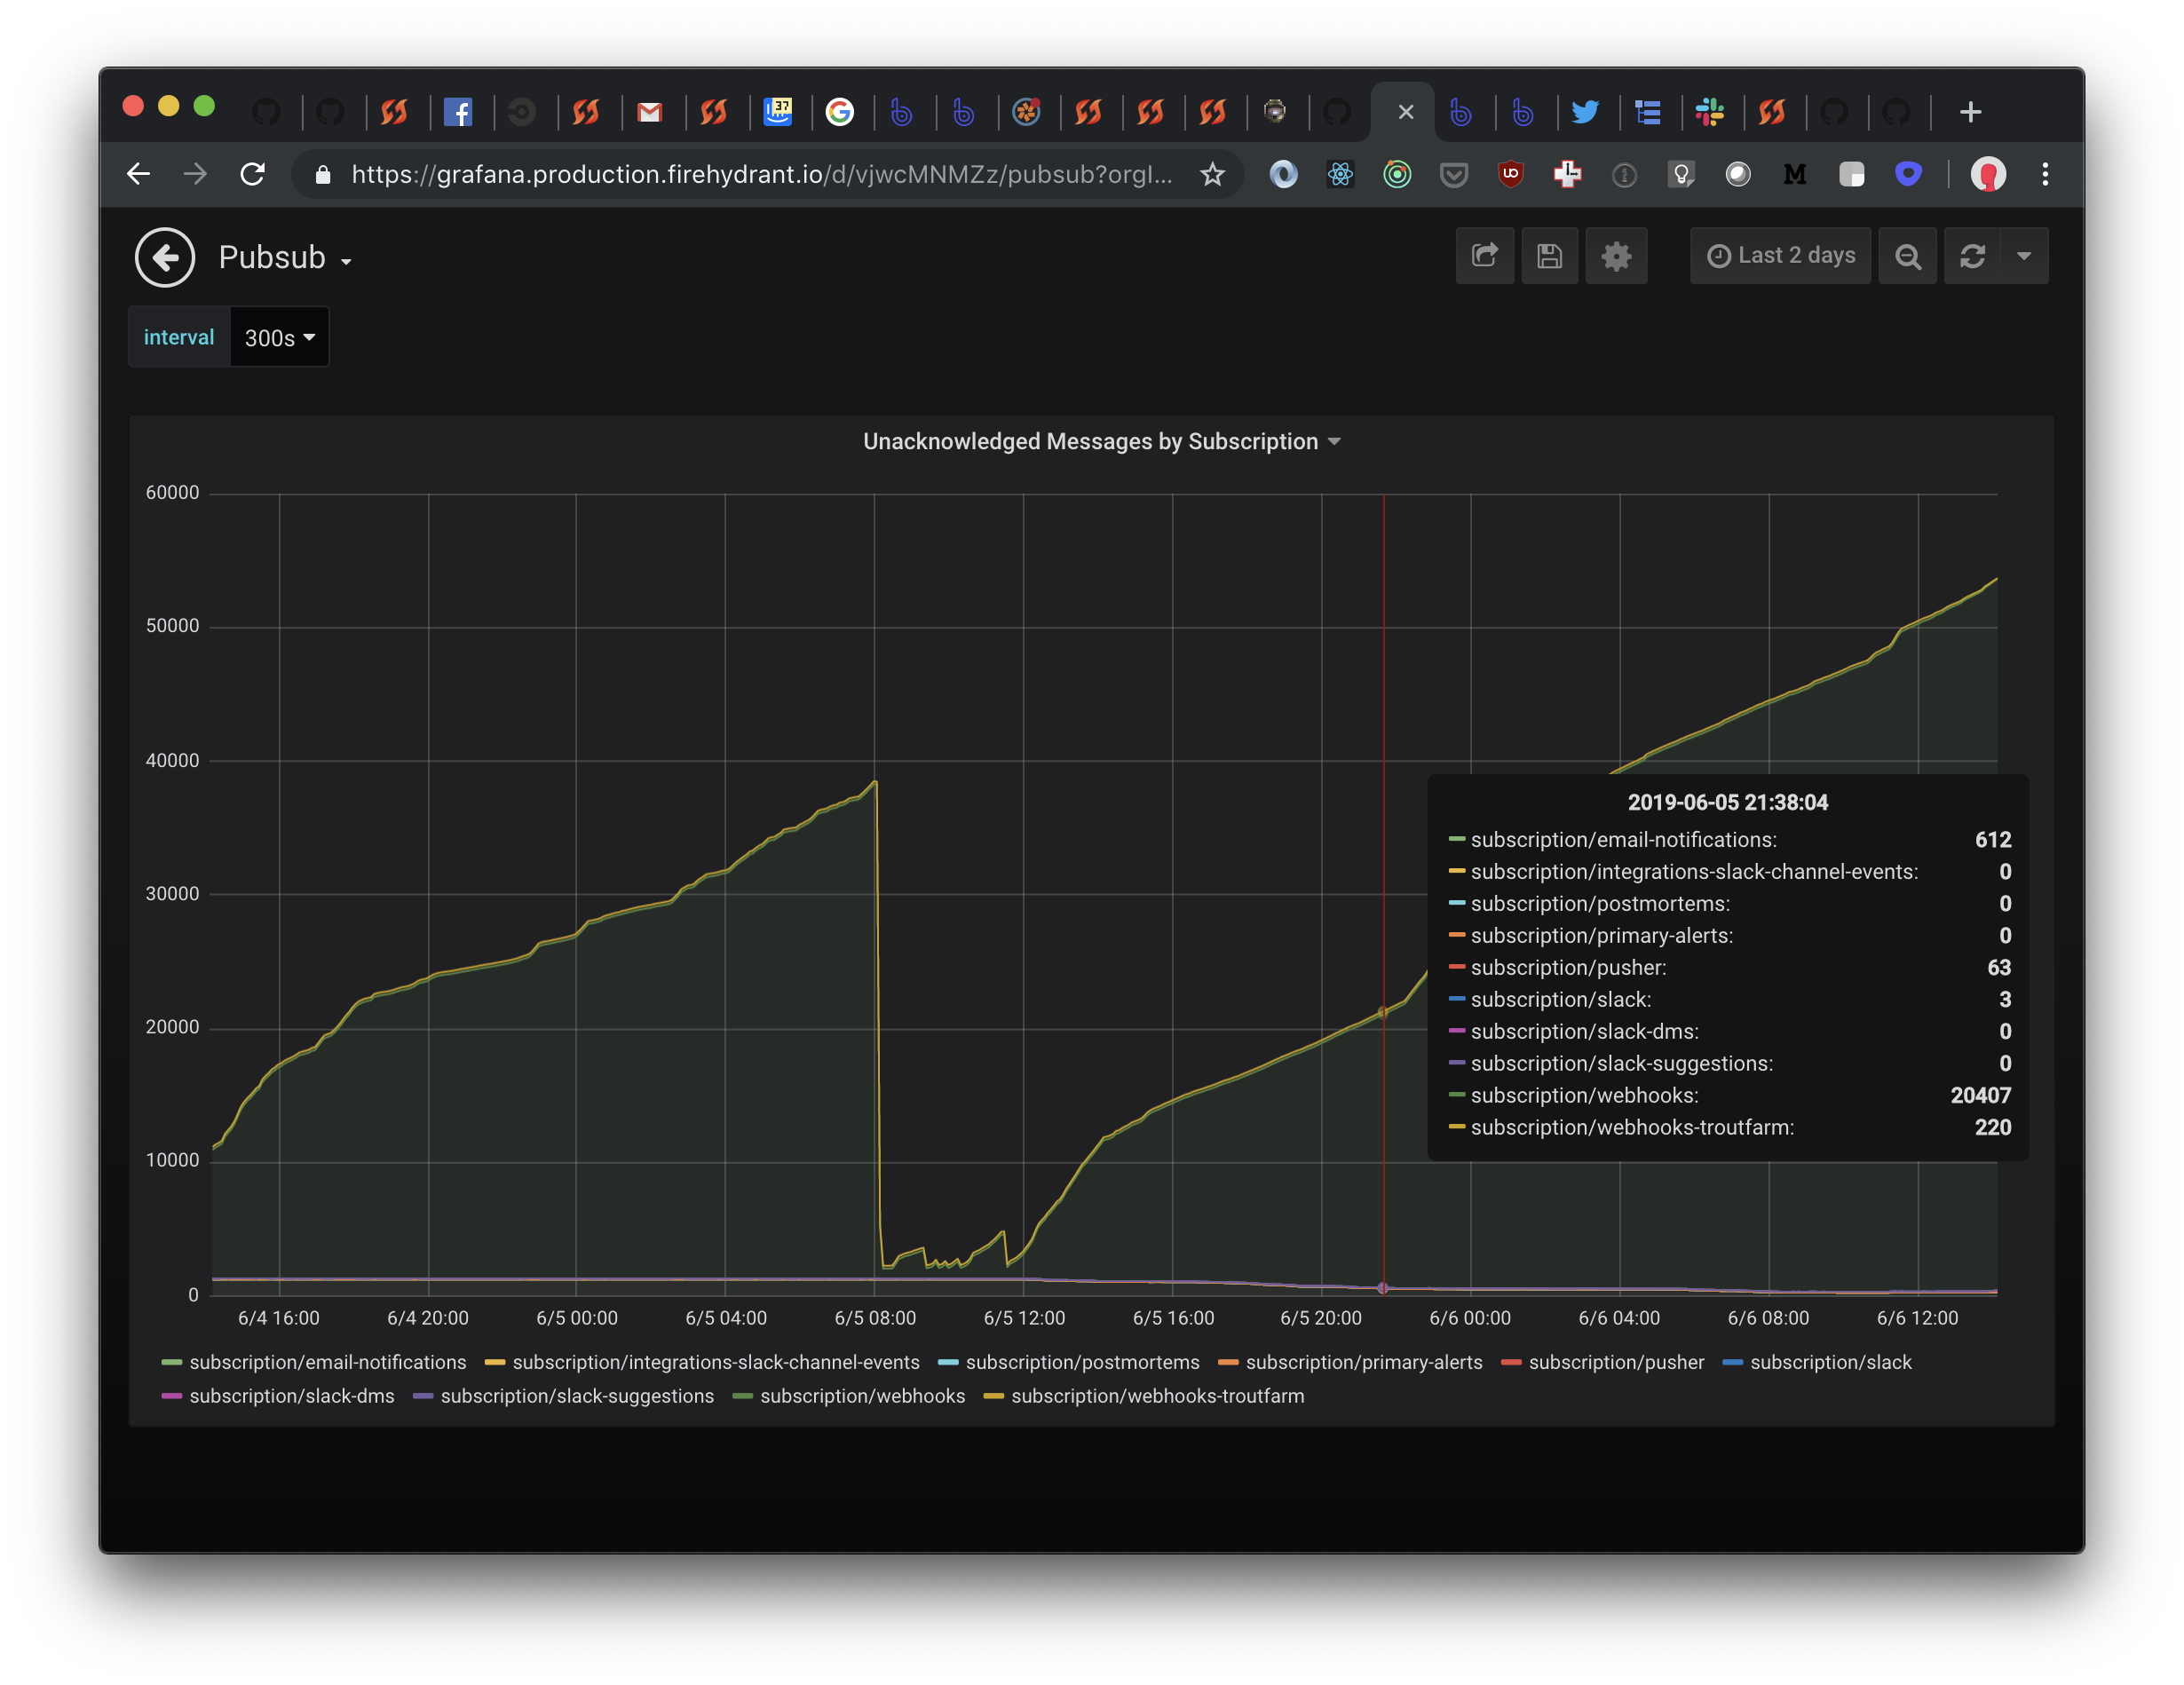
It seems like only one of our subscribers is dying in the application. I looked into the code for PubSub and I see Subscriber#stopped? but that seems to rely on an instance variable that will never be reset if the connection dies.
I also see a reload method on Subscriber, will that recreate the subscription connection possibly?
Edit:
Yes there's a sleep 1 in the subscriber... we hate it too.
 bobbytables
on 6 Jun 2019
bobbytables
on 6 Jun 2019
I'll also add, we have 3 pods popping messages off of the subscription for "slack' and 'webhooks', so it's really odd to see both of them stop completely while some of the other subscriptions are churning along no problem within the same process.
bobbytables
on 7 Jun 2019
@bobbytables Are you logging the on_error callback?
blowmage
on 7 Jun 2019
@bobbytables Are you logging the
on_errorcallback?
I'm pushing a change now with it. I also noticed our gem was a little out of date for pubsub. That also updated the grpc client gem to 1.21 too so I'll see if this fixes our issue.
bobbytables
on 7 Jun 2019
I have these logs coming out now:
, [2019-06-07T00:01:53.431466 #1]  WARN -- : bidi: read-loop failed
W, [2019-06-07T00:01:53.431583 #1]  WARN -- : 14:The service was unable to fulfill your request. Please try again. [code=8a75] (GRPC::Unavailable)
/opt/app/laddertruck/vendor/bundle/ruby/2.5.0/gems/grpc-1.21.0-x86_64-linux/src/ruby/lib/grpc/generic/active_call.rb:31:in `check_status'
/opt/app/laddertruck/vendor/bundle/ruby/2.5.0/gems/grpc-1.21.0-x86_64-linux/src/ruby/lib/grpc/generic/bidi_call.rb:209:in `block in read_loop'
/opt/app/laddertruck/vendor/bundle/ruby/2.5.0/gems/grpc-1.21.0-x86_64-linux/src/ruby/lib/grpc/generic/bidi_call.rb:195:in `loop'
/opt/app/laddertruck/vendor/bundle/ruby/2.5.0/gems/grpc-1.21.0-x86_64-linux/src/ruby/lib/grpc/generic/bidi_call.rb:195:in `read_loop'
/opt/app/laddertruck/bin/rake:1:in `each'
The Subscriber attempts to recover gracefully from Unavailable errors by retrying. Does it coincide with a Subscriber hanging?
blowmage
on 7 Jun 2019
I've been looking into this, but I still don't have a reproduction. But I do have a change to monitor the Subscriber Stream thread and restart the thread that pulls from the gRPC stream ever stops running. The thread shouldn't stop running, but since I don't have a reproduction I am trying things.
The change on my branch also relays any error occurring on the Subscriber Stream thread to the main thread, so which might also be useful for debugging.
If you are feeling adventurous, you might try using my branch. To use it, update your Gemfile with the following:
gem "google-cloud-pubsub", github: "blowmage/google-cloud-ruby", branch: "pubsub/subscriber-threading-monitor"
Hi @blowmage , so we upgraded the gem to latest for pubsub and pushed that out late afternoon. I also changed it to use .on_error instead. Both attempts haven't fixed it seems.
So we see the read-loop failed error and 3 seconds later our final message is popped off and processed. After that, read-loop failed doesn't appear at all until we kick the process again.
bobbytables
on 7 Jun 2019
No, rather the errors go away entirely which makes me think that the thread is in-fact dying. We're going to deploy your branch and see what happens.
For anyone else following along, here's the diff blowmage made:
https://github.com/googleapis/google-cloud-ruby/compare/master...blowmage:pubsub/subscriber-threading-monitor
bobbytables
on 7 Jun 2019
@bobbytables Do you have any calls made to on_error before it hangs?
blowmage
on 7 Jun 2019
@bobbytables Do you have any calls made to
on_errorbefore it hangs?
No errors have been sent to our error tracking from on_error and nothing in logs would indicate anything either that I can see.
bobbytables
on 7 Jun 2019
K, I have updated my branch with a logger to help us diagnose. Set the logger using Subscriber#logger=:
require "google/cloud/pubsub"

pubsub = Google::Cloud::PubSub.new

sub = pubsub.subscription "my-topic-sub"

subscriber = sub.listen do |received_message|
  # process message
  received_message.acknowledge!
end

# Register to be notified when unexpected errors occur.
subscriber.on_error do |error|
  Bugsnag.notify error
end

# Add a logger to the Subscriber
subscriber.logger = Logger.new STDOUT

# Start listening for messages and errors.
subscriber.start
I have another branch that does not add the thread monitoring, but makes a small change to how the thread is being restarted. It may be a candidate for the hanging behavior, but I don't know for sure. It would be very helpful if you could try it as well and let me know if it still hangs or not.
gem "google-cloud-pubsub", github: "blowmage/google-cloud-ruby", branch: "pubsub/subscriber-threading-restart"
I am considering creating a PR for this branch regardless, since it seems like a reasonable refactor.
blowmage
on 8 Jun 2019
The subscriber died and didn't start picking messages backup again with the thread monitor branch too.
There seems to be a correlation in "ActiveRecord Not Found" errors being ignored by Bugsnag, which also uses threads to dispatch errors to their API, and our subscriber dying. I'm enabling the error to actually go to Bugsnag for our pubsub subscriber to see if there's anything related... I feel like I'm chasing nothing at this point though.
bobbytables
on 9 Jun 2019
More correlation that I've found is that the subscribers that die the most for us are the ones that have the highest error rates. We have 3 subscribers that raise exceptions fairly frequently and they are the ones that die. The other ones with no exceptions raise in the same process keep chugging no problem.
bobbytables
on 9 Jun 2019
More correlation that I've found is that the subscribers that die the most for us are the ones that have the highest error rates.
I wonder if it might be an issue of filling the subscriber’s inventory with messages that are out for processing, but never acknowledged. Can you try making a call to #nack! in your error handler?
subscription = topic.subscription subscription

subscriber = subscription.listen do |message|
  sleep 1
  begin
    ActiveRecord::Base.connection_pool.with_connection do
      block.call(message)
    end
  rescue Exception => e
    Rails.logger.error e.inspect
    Rails.logger.error e.backtrace.join("\n")
    Bugsnag.notify(e)
    # Put the message back so it can be processed again
    message.nack!
  end
end

subscriber.start
@mrsimo Any chance you could try using the branch with the thread monitor and logger?
blowmage
on 10 Jun 2019
Can you try making a call to
#nack!in your error handler?
Does #on_error not receive the message as a parameter?
bobbytables
on 10 Jun 2019
@bobbytables Currently we are making the assumption that users will ack or nack the message in the callback. If you recover from an error and don't ack or nack, the message will remain in inventory. And my thinking here is that once you fill up your inventory the Subscriber will stop pulling new messages because the ones that it sent out to be processed remain in inventory.
This has led me to test a few other things, and I think I found a bug that would lead to the same situation: a full inventory that causes the subscriber to pause.
blowmage
on 10 Jun 2019
@mrsimo @bobbytables I have a new branch, with out any monitoring or logging or any other changes. But it fixes the bug I mentioned in my previous message. Can you try it and see if it fixes this behavior for you?
gem "google-cloud-pubsub", github: "blowmage/google-cloud-ruby", branch: "pubsub/inventory-method-chaining-bug"
Sorry I haven't provided an update for a while. Time zones and holidays!
We just had one occurrence of this (that I could see). I had added a few more metrics to monitor the consumers using prometheus_exporter. So apart from gc runs and the like, I also added a couple custom things. First, the number of threads running/sleeping. And then I tried to see if I could monitor some things from the subscriber itself, and I ended up adding a couple gauges with subscriber.stream_pool.count and subscriber.stream_pool.map(&:inventory).sum(&:count).
All metrics look pretty normal until the time where it got stuck, where I saw a bunch of log messages like this: Generating Prometheus metrics text timed out. This comes from inside prometheus_exporter, and I think it means that some of my custom code is hanging. At the moment I think one (or both) of those custom metrics on the subscriber times out.
I don't see much correlation between inventory and the consumer hanging either:
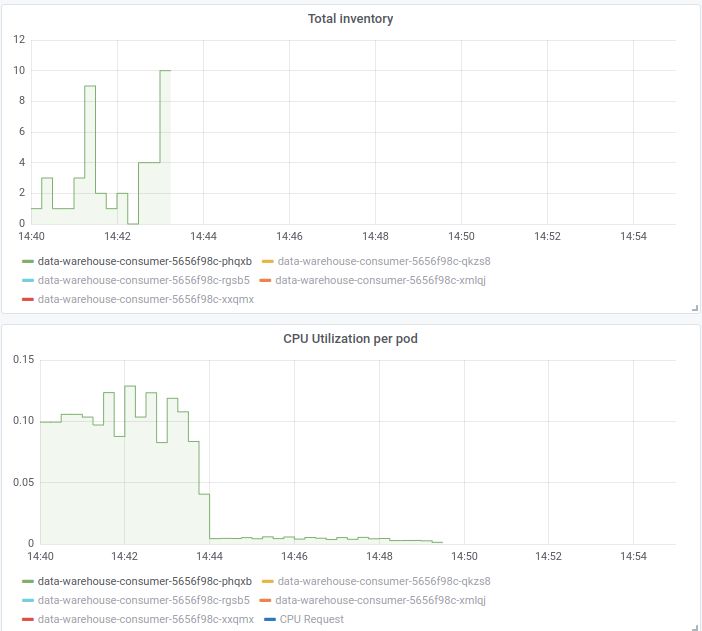
Metrics for inventory sops after it hangs, because of the timeouts I mentioned. I don't know what any of this means, just bringing it up, might make sense to you.
I'm back to work tomorrow, I'll try that branch then.
I am always calling acknowledge! in an ensure inside the listen block, by the way.
mrsimo
on 10 Jun 2019
At the moment I think one (or both) of those custom metrics on the subscriber times out.
Fascinating. Are those custom metrics thread safe?
Currently we aren't placing any monitoring or timeout on the subscriber's invocation of the provided user code. If the closure hangs it may block that one thread, and if all of the subscriber's threads are blocked that would stop the subscriber from processing.
I don't see much correlation between inventory and the consumer hanging
Wow, thank you for monitoring that! This helps immensely.
I am always calling
acknowledge!in anensureinside thelistenblock, by the way.
Yes, I saw that and assumed that @bobbytables was doing the same. But when I double checked the code he posted I noticed that he wasn't, so his issue might be different than your issue.
blowmage
on 10 Jun 2019
Ok I think I found a way to reproduce this: https://github.com/firehydrant/pubsub-bug-3413 - @blowmage can you maybe try that and see if I'm crazy?
bobbytables
on 10 Jun 2019
Currently we aren't placing any monitoring or timeout on the subscriber's invocation of the provided user code. If the closure hangs it may block that one thread, and if all of the subscriber's threads are blocked that would stop the subscriber from processing.
Oh, that's quite interesting. I'll triple check what we do in each consumer and add some timeouts as well!
mrsimo
on 10 Jun 2019
Are those custom metrics thread safe?
:thinking: I think so. Threaded code is really not my strength, but I don't see much that should make something unsafe. I'm just reading values.
mrsimo
on 10 Jun 2019
@bobbytables I suspect that #3451 may solve your issues of the Subscriber hanging after receiving many errors. I have been trying to get your docker repro to work and I haven't been successful yet. I will try again tomorrow. Would you mind switching it to master and seeing if it still shows the behavior of hanging when the inventory fills up?
If you pass an inventory argument to Subscription#listen you can lower the the size of the inventory you need to fill.
blowmage
on 11 Jun 2019
@blowmage Yup, pointed my test repo to master and it seems to churn through every message now regardless of raises. (Sorry my repo didn't work for you).
I think we can maybe close this now.
bobbytables
on 11 Jun 2019
Sorry for the lack of updates. Things have quite stable for a while, but today we have something.
Today one of the pods started timing out when gathering metrics, specifically on the bit where I'm gathering subscriber.stream_pool.count and subscriber.stream_pool.map(&:inventory).sum(&:count). One or both of those times out. This is the exact code that runs:
    def collect_subscriber_metrics
      Timeout.timeout(0.1) do
        @subscriber_streams.observe(subscriber.stream_pool.count)
        @subscriber_inventory.observe(subscriber.stream_pool.map(&:inventory).sum(&:count))
      end
    rescue Timeout::Error
      Utils.logger.error("Timeout in collect_subscriber_metrics")
    end
The timeout is a bit aggressive, but it's the first time it's happened for at least a week, and it happens every single time metrics are gathered now. I can see it's this bit (instead of the other stuff that is gathered) because of the specific error logged.
There's a few curious things for this pod after this moment. It started happening at ~15:30UTC and this pod is still processing messages. It might be because I'm running it with the Subscriber#listen default of 4 streams, I don't know.
Here's some screenshots from various graphs (ignore the titles, I'm showing only this pod all the time):
Running threads (looks normal):
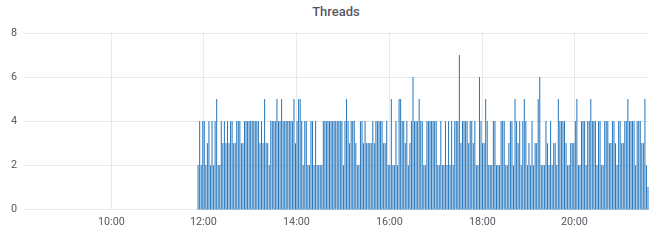
Sleeping threads (not so normal... but I wish I could see which ones are those... I don't think the metric gathering could be to blame, but who knows):
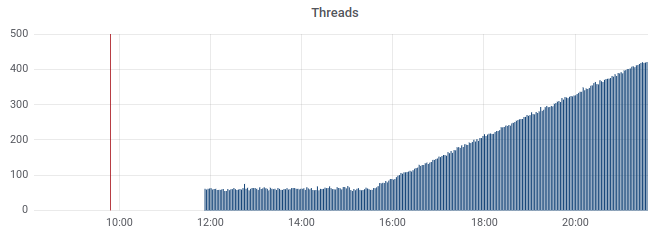
I don't see anything else interesting. CPU looks normal. Inventory/number of streams look normal until it stopped gathering these metrics. Object allocations and GC runs also look similar all the time.
There were a bunch of errors around the time this started (not sure if exactly before or exactly after), but these should be perfectly normal and rescued errors:
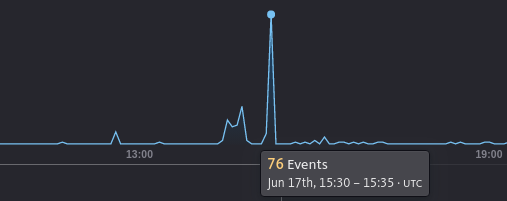
This is all still running the latest released version of the gem. I'm afraid I never got to try any of the branches you offered. Do you think either of them would work?
Hope some of this helps!
mrsimo
on 17 Jun 2019
@mrsimo Thanks for the update. We are about to release a new version of google-cloud-pubsub with all the recent changes. Once that is released can you update to use it?
The fact that you can't quickly pull the number of streams makes me wonder if there is a deadlock somewhere. (I don't know if that would cause the number of threads to increase like that though.) We have enough threading changes in the upcoming release that I would really like to know if you can also repro using it.
blowmage
on 18 Jun 2019
@mrsimo What settings are you passing to #listen now? Earlier you indicated it was:
{
  streams: 1,
  inventory: 250,
  threads: {
    callback: 2,
    push: 1
  }
}
I'm not passing any settings any more. Just plain subscriber.listen { ... }
mrsimo
on 18 Jun 2019
Oh, and:
We are about to release a new version of google-cloud-pubsub with all the recent changes. Once that is released can you update to use it?
Of course!
mrsimo
on 18 Jun 2019
Can you upgrade to 0.37.0 and let us know how it goes?
blowmage
on 18 Jun 2019
I have updated the thread monitoring branch to work off of the code in latest release. It adds a monitor to watch the subscriber's background thread and will restart it. It also adds some logging to help indicate more about what is going on. To use it add the following to your Gemfile:
gem "google-cloud-pubsub", github: "blowmage/google-cloud-ruby", branch: "pubsub/subscriber-threading-monitor"
To enable the logging add the following somewhere to your code:
require "logger"
require "google/cloud/pubsub"
Google::Cloud.logger = Logger.new STDOUT
When I updated this branch I moved where the logger is being set to Google::Cloud.logger. We don't have any logging in Google Cloud currently, as the focus has been on logging in the grpc or google-api-client libraries. But I thought this would be nicer and wanted to try it out. Let me know if this level of logging would be helpful to you.
blowmage
on 18 Jun 2019
I've deployed this branch and I'm capturing the logging. Will report back anything interesting, as usual.
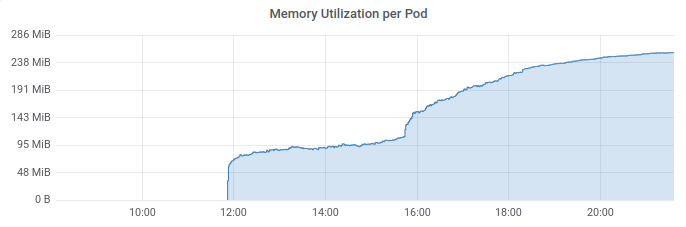
Thanks for keeping this issue open. I think since I changed to using the defaults of listen this has become less of an issue... perhaps because one stream might "die" but there's a few more that keep on working well. But it'd be good to figure it out regardless, the behavior so far is weird, and that increase in threads/memory is worrying.
Thanks @blowmage!
mrsimo
on 19 Jun 2019
@blowmage there seems to be an error in that branch. There's no e in this line.
NameError undefined local variable or method `e' for #<Google::Cloud::PubSub::Subscriber::Stream:0x000055ba2ae468a0>
    vendor/bundle/ruby/2.5.0/bundler/gems/google-cloud-ruby-a852dd386e34/google-cloud-pubsub/lib/google/cloud/pubsub/subscriber/stream.rb:258 block in background_run
    /usr/local/lib/ruby/2.5.0/logger.rb:465 add
    /usr/local/lib/ruby/2.5.0/logger.rb:527 info
    vendor/bundle/ruby/2.5.0/bundler/gems/google-cloud-ruby-a852dd386e34/google-cloud-pubsub/lib/google/cloud/pubsub/subscriber/stream.rb:405 log_info
    vendor/bundle/ruby/2.5.0/bundler/gems/google-cloud-ruby-a852dd386e34/google-cloud-pubsub/lib/google/cloud/pubsub/subscriber/stream.rb:256 rescue in background_run
    vendor/bundle/ruby/2.5.0/bundler/gems/google-cloud-ruby-a852dd386e34/google-cloud-pubsub/lib/google/cloud/pubsub/subscriber/stream.rb:183 background_run
    vendor/bundle/ruby/2.5.0/bundler/gems/google-cloud-ruby-a852dd386e34/google-cloud-pubsub/lib/google/cloud/pubsub/subscriber/stream.rb:304 block in start_streaming!


Caused by: GRPC::Internal 13:Received RST_STREAM with error code 2
    vendor/bundle/ruby/2.5.0/gems/grpc-1.21.0-x86_64-linux/src/ruby/lib/grpc/generic/active_call.rb:31 check_status
    vendor/bundle/ruby/2.5.0/gems/grpc-1.21.0-x86_64-linux/src/ruby/lib/grpc/generic/bidi_call.rb:209 block in read_loop
    vendor/bundle/ruby/2.5.0/gems/grpc-1.21.0-x86_64-linux/src/ruby/lib/grpc/generic/bidi_call.rb:195 loop
    vendor/bundle/ruby/2.5.0/gems/grpc-1.21.0-x86_64-linux/src/ruby/lib/grpc/generic/bidi_call.rb:195 read_loop
    bin/websocket_pubsub_consumer:1 each
LOL, of course. Fixed, please pull latest from that branch.
blowmage
on 19 Jun 2019
@mrsimo Any strange behavior lately?
blowmage
on 28 Jun 2019
Hi @blowmage. It's been reasonably quiet. We had a fun event where a 3rd party slowed one of the consumers down, and then messages accumulated (I guess default 1000 inventory * 4 streams got full pretty quick) and the pod kept running out of memory. When the pod was almost out of memory all sorts of funny things happened, including the timeout I mentioned gathering subscriber metrics.
Just bring this up because I think it's possible that weird things start happening when memory grows enough. We've decreased the inventory size and given them more memory, and so far everything is good.
I'll report back if something interesting happens. I understand if you want to close the issue. Thanks for being so responsive with all this :heart:
mrsimo
on 28 Jun 2019
I understand if you want to close the issue.
I don't want to close it, but we also don't have a reproduction of the original behavior described in the issue. I'm happy to keep it open for a bit longer in the hopes you can repro it.
blowmage
on 28 Jun 2019
I've had an app that stopped running after some time with no apparent reason (no errors logged on on_error). After recreating the pod it resumed work.
I suspected something outside of the consumer threads stopped working so we may have been affected by this issue.
Unlike the other reported issues here our code is still not running in production so we don't have a lot of detailed graphs to add at this point. We've updated to the latest gem version and will post here if it happens again.
 Draiken
on 1 Jul 2019
Draiken
on 1 Jul 2019
One thing we could do is to recreate the stream if we haven't seen a message in some given amount of time. This wouldn't prevent a stream from hanging, but it would help it recover when it does. Thoughts?
blowmage
on 1 Jul 2019
One thing we could do is to recreate the stream if we haven't seen a message in some given amount of time.
I thought if doing something like that with a liveness probe, so it would restart the pod entirely. But we have staging environments where consumers might sit for hours without getting a single message, so they'd churn pods unnecessarily.
Things seem to have been going quite fine for a longer while. I'd be happy to close the issue, if you don't mind me reopening it again if I come up with some useful information.
mrsimo
on 4 Jul 2019
Okay, let’s close this issue. If this does happen again, please open a new issue and link to this one. Thanks for all your help!
blowmage
on 5 Jul 2019
FWIW we're still seeing this. Under heavy load it just stops across subscribers (we have multiple running at the same time in the same process).
 ce07c3
on 21 Dec 2019
ce07c3
on 21 Dec 2019
It would help the team that maintains this a lot if you provided information such as gem version.
bobbytables
on 21 Dec 2019
google-cloud-pubsub (1.1.0)
      concurrent-ruby (~> 1.1)
      google-cloud-core (~> 1.2)
      google-gax (~> 1.8)
      googleapis-common-protos (>= 1.3.9, < 2.0)
      grpc-google-iam-v1 (~> 0.6.9)
Under heavy load we see the # of threads bouncing up and down. We're still debugging so I'll add more information soon.
ce07c3
on 21 Dec 2019
@ce07c3 Can you open a new issue with all the requested information? Any logging output would also help. Are you logging errors using on_error?
blowmage
on 23 Dec 2019
Related issues
 premist
·
3Comments
premist
·
3Comments
 arslanmurtaza
·
4Comments
arslanmurtaza
·
4Comments
 quartzmo
·
3Comments
quartzmo
·
3Comments
 jeremywadsack
·
3Comments
jeremywadsack
·
3Comments
 murjax
·
4Comments
murjax
·
4Comments