Google-cloud-go: pubsub: Intermittent processing slowdown
Client
PubSub
Environment
Ubuntu Linux Bionic VM on GCE
Go Environment
wstorey_maxmind_com@vagrant-wstorey:~/mm_website (main)$ go version
go version go1.16.3 linux/amd64
wstorey_maxmind_com@vagrant-wstorey:~/mm_website (main)$ go env
GO111MODULE=""
GOARCH="amd64"
GOBIN=""
GOCACHE="/home/wstorey_maxmind_com/.cache/go-build"
GOENV="/home/wstorey_maxmind_com/.config/go/env"
GOEXE=""
GOFLAGS=""
GOHOSTARCH="amd64"
GOHOSTOS="linux"
GOINSECURE=""
GOMODCACHE="/home/wstorey_maxmind_com/go/pkg/mod"
GONOPROXY=""
GONOSUMDB="github.maxmind.com/*"
GOOS="linux"
GOPATH="/home/wstorey_maxmind_com/go"
GOPRIVATE=""
GOPROXY="https://go-proxy.maxmind.com/"
GOROOT="/usr/local/go"
GOSUMDB="sum.golang.org"
GOTMPDIR=""
GOTOOLDIR="/usr/local/go/pkg/tool/linux_amd64"
GOVCS=""
GOVERSION="go1.16.4"
GCCGO="gccgo"
AR="ar"
CC="gcc"
CXX="g++"
CGO_ENABLED="1"
GOMOD="/dev/null"
CGO_CFLAGS="-g -O2"
CGO_CPPFLAGS=""
CGO_CXXFLAGS="-g -O2"
CGO_FFLAGS="-g -O2"
CGO_LDFLAGS="-g -O2"
PKG_CONFIG="pkg-config"
GOGCCFLAGS="-fPIC -m64 -pthread -fmessage-length=0 -fdebug-prefix-map=/tmp/go-build2229490606=/tmp/go-build -gno-record-gcc-switches"
Code
I don't have a small reproducer currently. I actually don't know how to reproduce it even with our full service. It is happening about once a day since Wednesday.
Expected behavior
Message processing (receiving and then acking) continues at a consistent rate.
Actual behavior
Recently we have had a handful of situations where a daemon processing messages from a Pub/Sub subscription apparently greatly slows down such that we end up with a large backlog of messages. Restarting the daemon resolves the issue. They began on Wednesday after things being stable.
- 2021-05-05 at approximately 13:51 Pacific
- 2021-05-06 at approximately 07:02 Pacific
- 2021-05-06 at approximately 07:51 Pacific
- 2021-05-06 at around 10:12 Pacific
- 2021-05-06 at around 10:22 Pacific
- Once 2021-05-07 at approximately 19:40 UTC
I'm not sure there's enough to really diagnose what is going on, but it appears to be stuck inside the pubsub package somewhere.
Currently we are theorizing that there is a connection problem to Pub/Sub or perhaps an issue with the Pub/Sub server we're connected to. We're hoping you might be able to point us in the direction of figuring out what is going on.
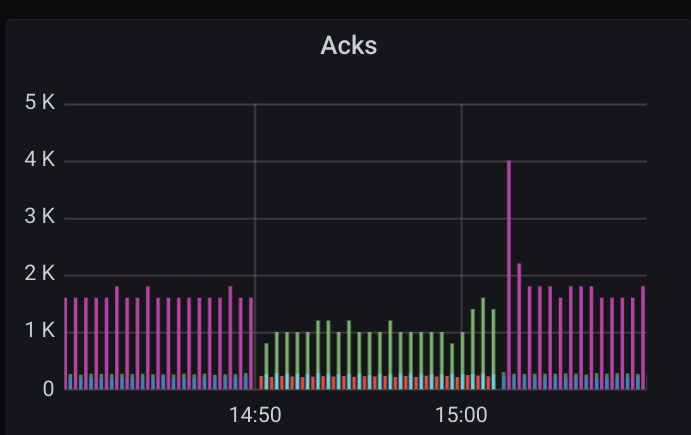
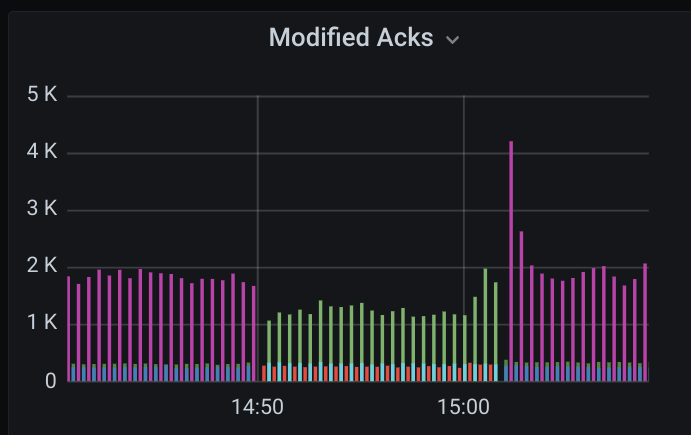
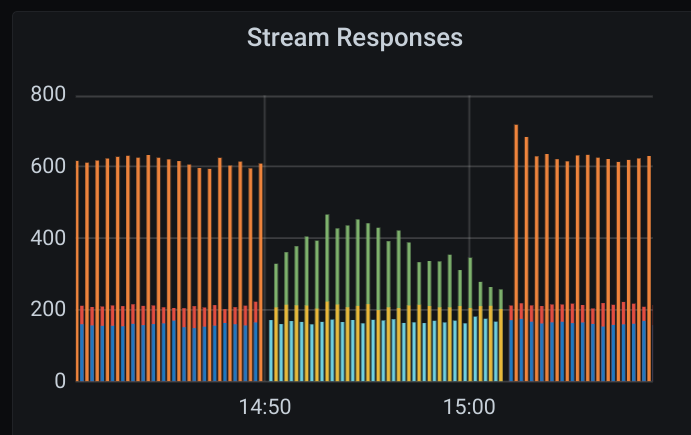
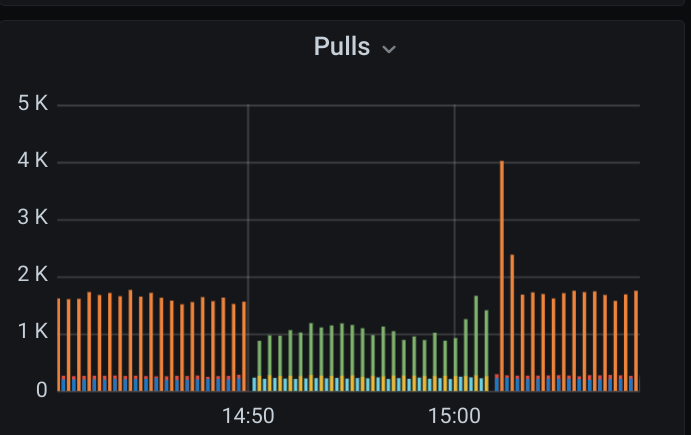
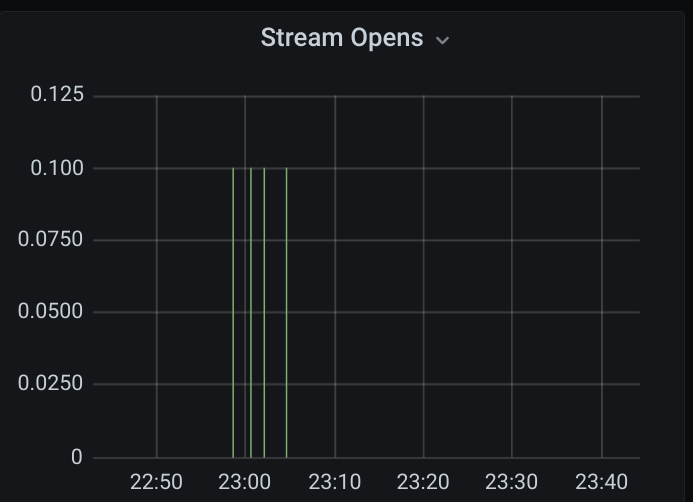
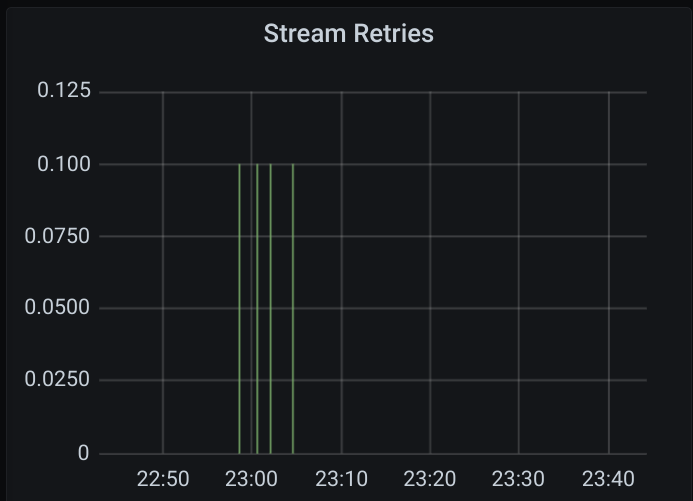
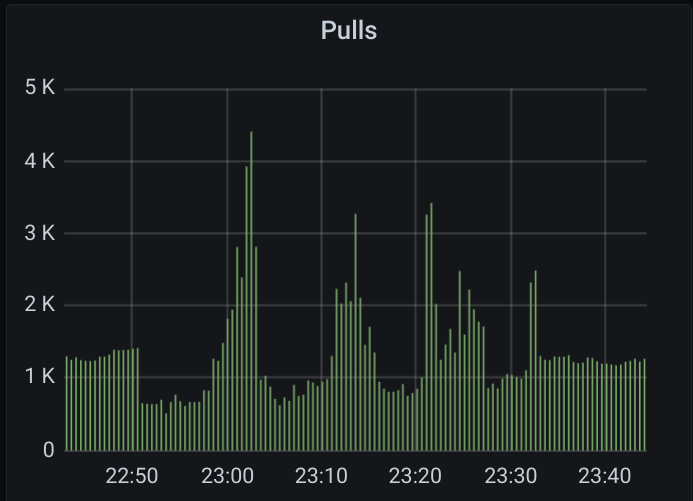
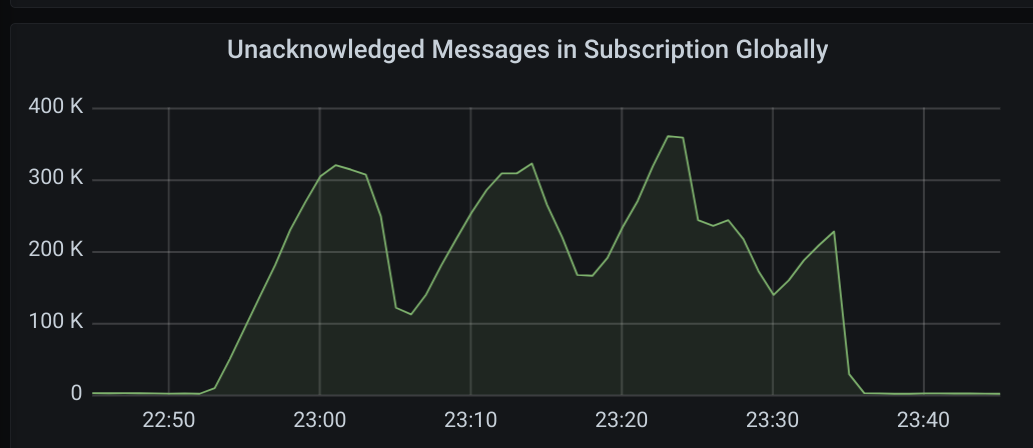
Screenshots
These are from the most recent event.
Opencensus ACKs up to the time we restarted it:

Opencensus modified ACKs, likewise:

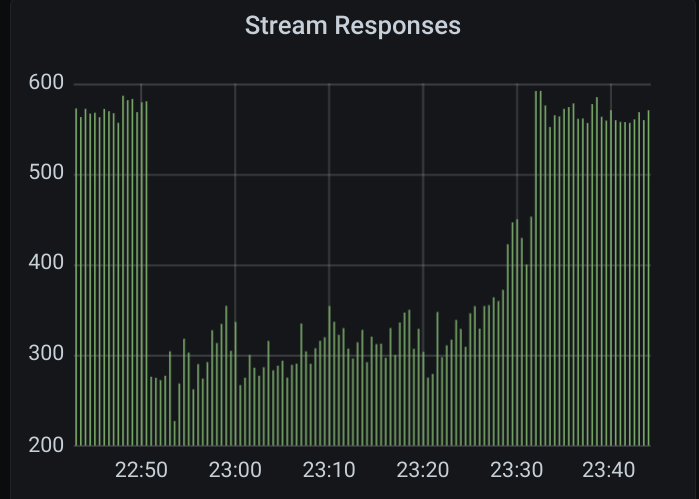
Opencensus stream responses, likewise:

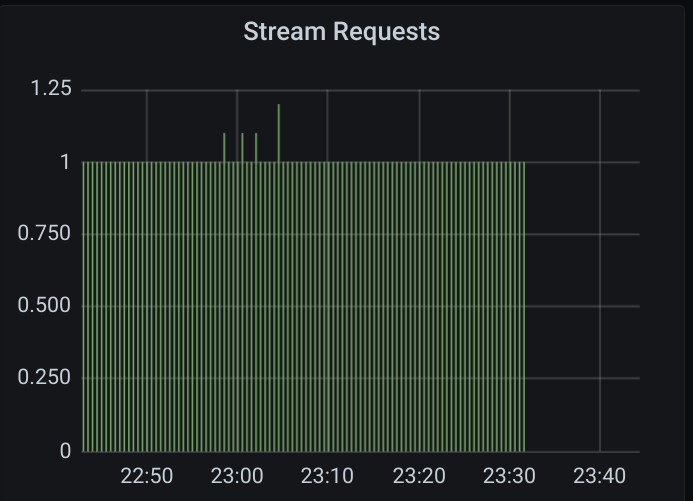
Opencensus pulls, likewise:

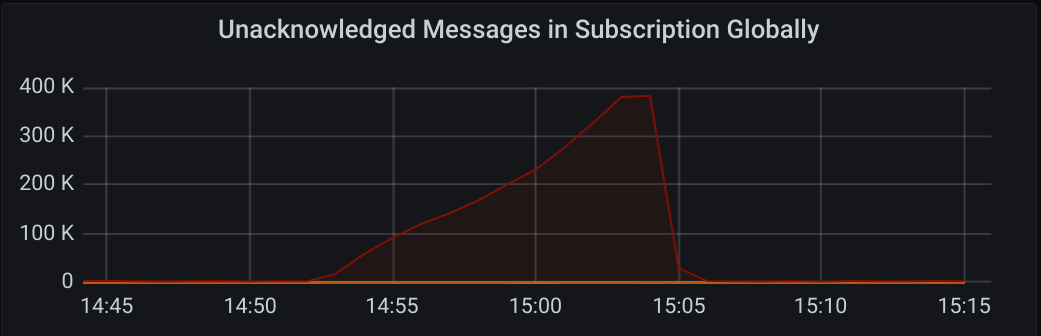
Opencensus outstanding messages, likewise:

Successful ACKs (from Google's side, note the timestamps do not exactly line up with the Opencensus ones AFAIK):

Expired ACKs (likewise):

Unacked messages (likewise):

I have a few more graphs (including more opencensus data). I included ones that looked interesting.
Additional context
We are on cloud.google.com/go/pubsub v1.10.1. We had updated to v1.10.3 but downgraded to see if the version update was related since we deployed v1.10.3 shortly before the first time we saw this.
The most recent time this happened I captured traces from a SIGQUIT: https://gist.github.com/horgh/76e9093c2cf48a04cf1a4ab0c1f82200
This shows me that we have no messages in flight (in our code that is) being processed. We are sitting in a Receive() call however.
 horgh
horgh
All 16 comments
Hey, thanks for reporting this issue.
A couple of things: could you try reverting to an earlier version to confirm if this is a client library issue vs server side issue? Something like v1.8.0 should give us more information here.
In addition, could you also post your subscriber's ReceiveSettings?
 hongalex
on 8 May 2021
hongalex
on 8 May 2021
Thank you for looking!
I should be able to switch to 1.8.0 on Monday.
As far as ReceiveSettings: We use the default except for:
MaxExtensionis 10 minutesMaxOutstandingMessagesis 20,000
horgh
on 8 May 2021
We've downgraded to 1.8.0. I'll let you know if it happens again.
Note that we were last on 1.8.x in early January. On January 5 we updated from 1.8.3 to 1.9.1.
We experienced this issue once more Friday afternoon and again on Saturday.
horgh
on 10 May 2021
So far this hasn't happened again. 🤔
horgh
on 12 May 2021
I spoke too soon! This just happened, I believe.
Here are some screenshots of the graphs. Note that this happened when we were running an update where our Pub/Sub subscriber failed over to another (as the first was being updated). The one we switched to experienced the slow processing rate. The update then reached the second subscriber and we switched back to the now updated first, resolving the issue this time.
horgh
on 12 May 2021
Thanks for the details. I have a few more follow up questions:
- Judging from your ack rate, you're publishing messages at about 1000 messages/second. Is that right?
- From your recent comment, was the update related to changing the Pub/Sub library version or something different entirely?
- When you switch between subscribers, are you just allowing the messages expire or do you actively
nackthem?
hongalex
on 12 May 2021
- It fluctuates, but 1000 messages/second is a reasonable approximation. Sometimes around 1500, sometimes around 500.
- It was a deployment of our system generally. We didn't change the Pub/Sub library version this time. Sorry for being unclear!
- When we stop a worker, we NACK messages. We don't exit until
Receive()returns, which I think means we must have ACK'd/NACK'd all messages we've received.
Note in other cases, such as in the graphs I showed at first, this happened without us switching between subscribers. Perhaps we got lucky when switching over today or something :-P.
horgh
on 12 May 2021
I was thinking about the above, and I think what we see is ~1000 message publish operations per second rather than messages per second, as I recalled the library batches messages. I'm not clear on whether the graph is talking about individual messages or not. It probably doesn't matter here though :-).
horgh
on 13 May 2021
We've had this happen a few more times:
- 2021-05-12 16:15 Pacific
- 2021-05-12 17:51 Pacific
- 2021-05-12 20:11 Pacific (recovered on its own)
- 2021-05-13 05:51 Pacific (recovered on its own)
- 2021-05-13 07:11 Pacific
One interesting aspect to all of the above is it seems like the subscriber periodically makes more progress on the messages, and was able to eventually recover if no action was taken in a couple instances (the other instances perhaps would have recovered too but we intervened). I don't know if this behaviour difference from the first I showed is because of the change to 1.8.0 or not though.
Here are some graphs of the 2021-05-12 16:15 case:
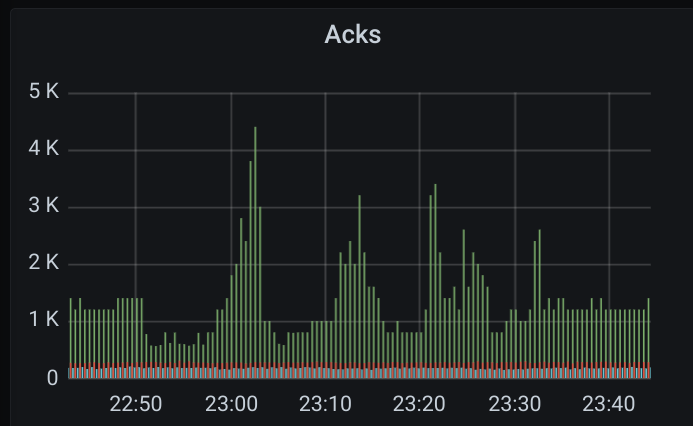
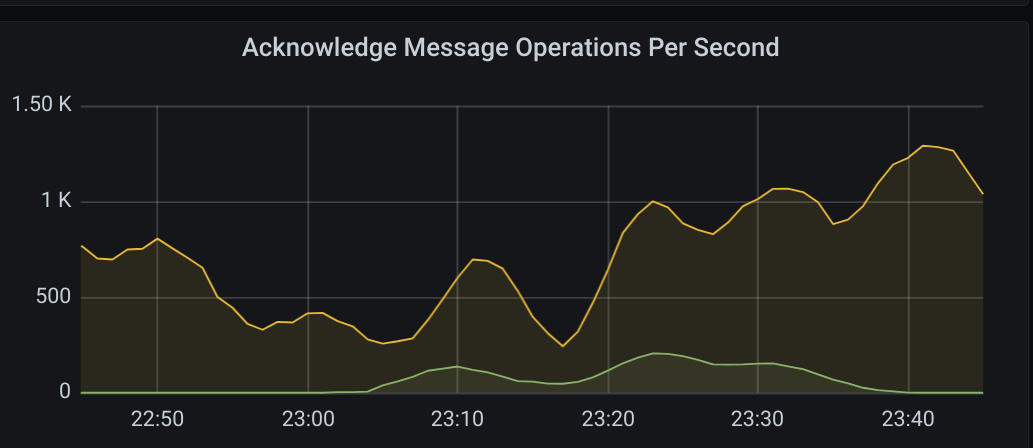
(the green here shows expired acks)
horgh
on 13 May 2021
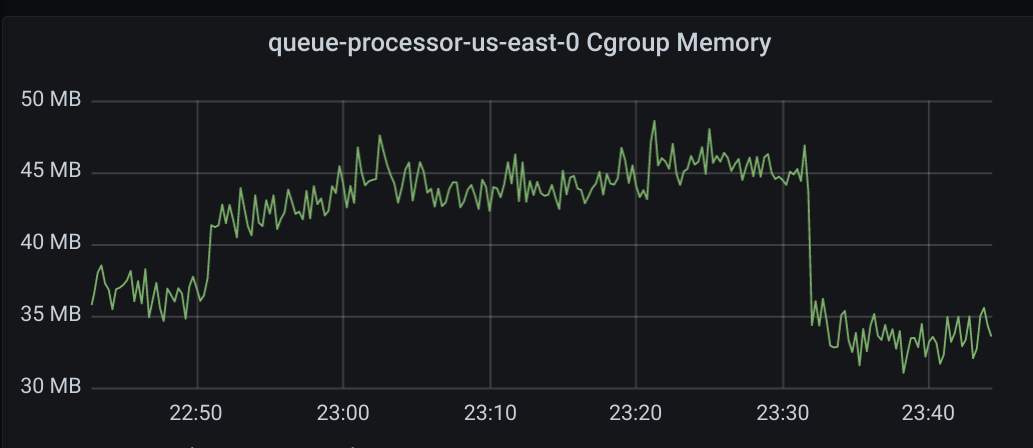
Any chance you have pprof data from that time period? I see memory usage goes up (the queue-processor-us-east-0 Cgroup Memory graph) -- I wonder why.
 tbpg
on 13 May 2021
tbpg
on 13 May 2021
No pprof data unfortunately. I will see if I can get that set up to collect for next time.
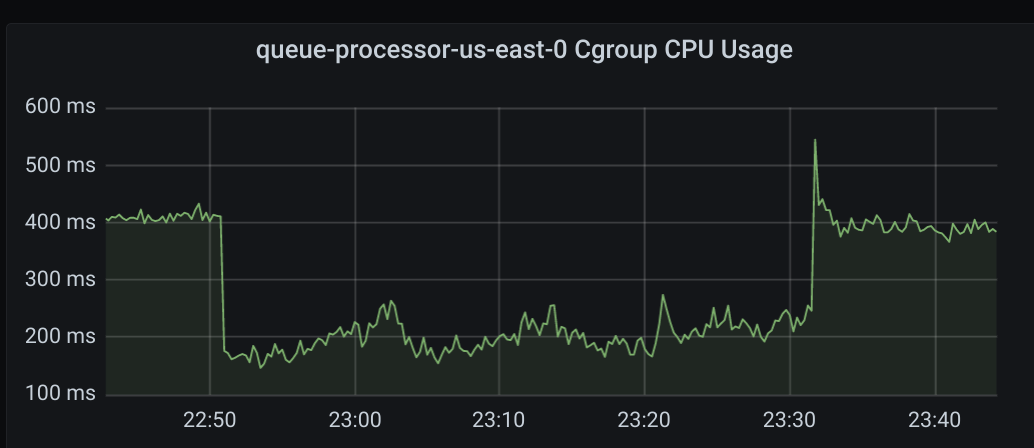
I was wondering if it could be that we were holding on to messages that weren't being ACKed that could be causing the memory increase. It's interesting the CPU use goes down too!
horgh
on 13 May 2021
Hm yeah that 10 MB increase does seem to be related to outstanding messages, which makes sense given your 20,000 limit for max outstanding messages.
Given that CPU usage seems to be stable, I would recommend increasing NumGoroutines to see if that helps. I don't think it will address the underlying issue of subscriber slowdown (which I'm still looking to try to reproduce), but hopefully it mitigates it a bit.
hongalex
on 13 May 2021
Thanks! I'll give that a shot. Is there any value you think would make sense? I'm thinking maybe 50, arbitrarily :-P.
horgh
on 13 May 2021
There might have been an issue with subscriber issues around these days which have since been resolved. I'm wondering if you're still experiencing this issue since you last commented? In addition, do you happen to have a support contract available? If so, that would allow more information to be retrieved from topic/subscription/project IDs that shouldn't be shared on github.
hongalex
on 18 May 2021
It hasn't happened since the last I mentioned. That's good news at least that it might be fixed separately!
Yeah, we have a support contract I believe. Are you suggesting we open a ticket, or what were you proposing?
horgh
on 18 May 2021
Glad it seemed to have been resolved! I was going to suggest opening a ticket if it continued to happen so we can look at more detailed metrics from the server side. Feel free to disregard now!
hongalex
on 19 May 2021
Related issues
 rntk
·
3Comments
rntk
·
3Comments
 MoreThanCarbon
·
3Comments
MoreThanCarbon
·
3Comments
 ianrose14
·
3Comments
ianrose14
·
3Comments
 eriklott
·
4Comments
eriklott
·
4Comments
 GlennAmmons
·
3Comments
GlennAmmons
·
3Comments