Google-cloud-go: logging: request scoped log entries + latencies
I'm in the process of trying to move an application from MVM to env:flex and as part of that am trying to use the "cloud.google.com/go/logging" library since the "google.golang.org/appengine/log" isn't supported for flex.
I'm having two major issues:
1) I can't get latency to show up in the log line in the console UI. For example:
entry := logging.Entry{
HTTPRequest: &logging.HTTPRequest{
Request: req,
Latency: end.Sub(start),
Status: crw.Status,
ResponseSize: crw.Size,
RemoteIP: req.RemoteAddr,
},
InsertID: "some id"
Severity: logging.Debug,
}
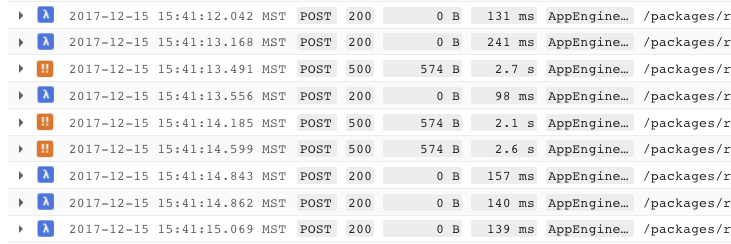
When i inspect the log line in the app engine UI I see:
14:56:41.593 POST 200 76.3 KB ApacheBench/2.3 /rpc/getInfo
The latency is missing even though if I click through on the httpRequest object inside the log record, it's set.
2) There is no way to group logs from a single request context together. With appengine/log as long as I used appengine.NewContext, any log records written with that context would appear nested in the log viewer inside of that request. I notice that the protoPayload.line array has all of these additional log records but that isn't supported with cloud.google.com/go/logging. There seems to be no way to do something similar with the cloud.google.com/go/logging library. Or is there?
 amersc
All 24 comments
What's the MonitoredResource you're logging against?
 jba
on 7 Dec 2016
jba
on 7 Dec 2016
I don't actually explicitly set one.
amersc
on 7 Dec 2016
Have you tried HTTPRequest? Is that the thing you want?
 shantuo
on 9 Dec 2016
shantuo
on 9 Dec 2016
(1) is a bug. A report has been filed internally.
jba
on 9 Dec 2016
Thanks @jba .. I've worked around 1 with a hack for now (appending the latency to the request method string)
Number 2 is the bigger worry for me. The only way I see right now is to log some json payload and have that piped to bigquery and do queries there but that introduces a significant delay in being able to look at logs.
amersc
on 9 Dec 2016
Is there any comment on (2) ? I am also struggling with this, it basically makes the log package rather useless, as there is almost always more than 1 log line per request
 luna-duclos
on 22 Feb 2017
luna-duclos
on 22 Feb 2017
This is do-able now. You need to set the appengine.googleapis.com/trace_id label on your request entries ... there is some javascript in the logs ui that will merge them together...
amersc
on 8 Mar 2017
@luna-duclos @amersc Have either of you tried this out yet? I'm curious whether it feels the same as original App Engine logs.
 derekperkins
on 16 Mar 2017
derekperkins
on 16 Mar 2017
@derekperkins I have, it works quite well, and looks 100% identical to appengine's logs.
luna-duclos
on 16 Mar 2017
Hallelujah! Now if only Cloud Tasks would perform a similar miracle and go GA 12 months early. :)
derekperkins
on 16 Mar 2017
Sorry, I deleted your meme before they spread.
 bradfitz
on 16 Mar 2017
bradfitz
on 16 Mar 2017
I did ultimately go with another approach though: If you set "@type" in the
payload to "type.googleapis.com/google.appengine.logging.v1.RequestLog",
you get all the display magic AppEngine gets from the log displayer, though
that does mean having to figure out which magic fields correspond to which
display .. I had little trouble comparing with an actual appengine app to
figure that out.
On Thu, Mar 16, 2017 at 5:24 AM, Derek Perkins notifications@github.com
wrote:
Now if only Cloud Tasks would perform a similar miracle and go GA 12
months early. :)—
You are receiving this because you were mentioned.
Reply to this email directly, view it on GitHub
https://github.com/GoogleCloudPlatform/google-cloud-go/issues/448#issuecomment-286954495,
or mute the thread
https://github.com/notifications/unsubscribe-auth/AFUXAL0LrtN8FJUepSdqYlyvd60dDH3Yks5rmLmMgaJpZM4LDVgH
.
luna-duclos
on 16 Mar 2017
@luna-duclos That's a very interesting way to get around it.
@bradfitz I totally understand resisting the meme onslaught. :) Believe me that my hallelujah meme wasn't thrown around lightly. I've looked into 10+ logging platforms trying to find anything near as great as the default GAE logging experience, and along with the task queue, is the biggest struggle for us as we move to GKE. I'm very passionate about the logging experience we've gotten spoiled by.
derekperkins
on 16 Mar 2017
I don't see anything to do here for the client libraries. Closing.
jba
on 11 Dec 2017
Having just gone through a lot of work to figure this out, I'd like to pay it forward from the various Googlers who helped me out. While this is all doable via the existing client library, I think there is a lot that could be done to make this easier for the default user. Here's a step by step process of how we mimicked the request grouping as we migrated from the old GAE logging library.
- There need to be separate parent vs child log files (e.g. request_log and request_log_entries)
parentLogger = client.Logger("request_log")
childLogger = client.Logger("request_log_entries")
- These two logs are connected by the
tracefield. When browsing in the UI, you will be looking at therequest_log, and when you expand a single item, it does an async lookup for child rows fromrequest_log_entrieswith the sametrace. - Your standard log entries will look something like this:
func log(c context.Context, payload string, severity logging.Severity) {
    e := logging.Entry{
        Payload:  payload,
        Severity: severity,
        Trace:    myTraceID,
    }

    childLogger.Log(e)
}
- At the end of your request, you'll add a parent log entry with details about the response, which are used in the UI. You'll want to have access to the original request, the response code, and the timing details for latency. We also keep track of the max logging severity of all the child logs in the context, so that when writing the parent entry we can use the max to help summarize what will be seen on expansion.
// finishRequest doesn't log any payload, it just provides the http request, response size and status code
func finishRequest(c context.Context, r *http.Request) {
    e := logging.Entry{
        Trace:    myTraceID,
        Severity: bubbledUpMaxLogSeverity,
        HTTPRequest: &logging.HTTPRequest{
            Request:      r,
            Status:       myStatusCode,
            Latency:      myMeasuredLatency,
            ResponseSize: myResponseSize,
        },
    }

    parentLogger.Log(e)
}
- For long-running requests, you may want to see a parent log entry before the end of the request. This won't have the latency or response code obviously, but does provide a way to see your child logs while the request is still in flight. The Stackdriver UI doesn't do anything to merge these, so you'll have multiple parent logs that both load the same child records when expanded, due to them having the same
trace.
// partialParentLog is called after N seconds to provide a log entry in the
// main Stackdriver log stream to aggregate the child logs. Should only be
// called for long running requests
func partialParentLog(c context.Context, r *http.Request) {
    e := logging.Entry{
        Trace:   myTraceID,
        Severity: bubbledUpMaxLogSeverity,
        HTTPRequest: &logging.HTTPRequest{
            Request: r,
        },
    }

    parentLogger.Log(e)
}
derekperkins
on 15 Dec 2017
Thanks for the update! I should have followed up earlier, maybe could have helped, but I actually ended up doing something similar: https://chromium.googlesource.com/infra/luci/gae/+/master/impl/cloud/request.go
 danjacques
on 10 Feb 2018
danjacques
on 10 Feb 2018
No worries, thanks for the link! I just happened to come across your issue tonight, and I know I appreciate finding breadcrumbs for how to solve something.
derekperkins
on 10 Feb 2018
@derekperkins How do you generate the myTraceID? Is it unique for each request?
 cnbuff410
on 23 Feb 2018
cnbuff410
on 23 Feb 2018
Can answer for my implementation, but in AppEngine Flex environment you are given a trace ID in the incoming request HTTP header.
Otherwise, if you're not running in AppEngine, you can simply generate any unique ID at the start of your request. The ID has no powers in a standalone environment, and is simply used to differentiate one request from another, so any unique value is sufficient.
danjacques
on 23 Feb 2018
Yep, exactly the same as @danjacques.
v := req.Header.Get("X-Cloud-Trace-Context")
if v == "" {
    ctx = WithTraceID(c, fmt.Sprintf("%s.%d.%s", instanceName, time.Now().UnixNano(), shortuuid.New()))
} else {
    ctx = WithTraceID(c, v)
}
grouplogger wraps the Stackdriver logging client, abstracts the Entry manipulations required for grouped logging from Flex and elsewhere: https://godoc.org/github.com/vimeo/grouplogger
 lukasschwab
on 21 Jul 2018
lukasschwab
on 21 Jul 2018
Hi, is issue number (2) @amersc reported addressed for GKE environments too? I tried the suggested workarounds with no results. Thanks.
 sescotti
on 24 Jul 2018
sescotti
on 24 Jul 2018
@sescotti It doesn't matter where you are running, Stackdriver will group log lines with the same trace id. I'm using this in multiple environments, including GKE and external cloud k8s and it works just the same.
derekperkins
on 24 Jul 2018
As of 7f7e4d352c2fef3a70b324191ae3c6ba6ae9e1cb the logging client automatically sets Entry.Trace to the value of the X-Cloud-Trace-Context header if it isn't already set.
jba
on 26 Jul 2018
Related issues
 deelienardy
·
3Comments
deelienardy
·
3Comments
 GlennAmmons
·
3Comments
GlennAmmons
·
3Comments
 eriklott
·
4Comments
eriklott
·
4Comments
 dragan-cikic-shortcut
·
3Comments
dragan-cikic-shortcut
·
3Comments
 sharkyze
·
4Comments
sharkyze
·
4Comments
Most helpful comment
Having just gone through a lot of work to figure this out, I'd like to pay it forward from the various Googlers who helped me out. While this is all doable via the existing client library, I think there is a lot that could be done to make this easier for the default user. Here's a step by step process of how we mimicked the request grouping as we migrated from the old GAE logging library.
tracefield. When browsing in the UI, you will be looking at therequest_log, and when you expand a single item, it does an async lookup for child rows fromrequest_log_entrieswith the sametrace.trace.