Google-cloud-dotnet: Tracing not working in GKE with Google.Cloud.Diagnostics.AspNetCore 3.0.0-beta13; works locally
Purpose
Use Google Cloud Diagnostics on a .net core REST API, for Logging, Tracing and Error Reporting in two possible scenarios:
- Local execution on Visual Studio 2017
- Deployed on a Docker Container and Running on a GCP Kubernetes Engine
Description
For configuring Google Cloud Diagnostics, two documentation sources were used:
- Google.Cloud.Diagnostics.AspNetCore
- Enable configuration support for Google.Cloud.Diagnostics.AspNetCore #2435
Based on the above documentation the UseGoogleDiagnostics extension method on IWebHostBuilder was used, as this configures Logging, Tracing and Error Reporting middleware.
According to the 2) link, the following table presents the information needed when using the UseGoogleDiagnostics method:

- For local execution => project_id, module_id, and version_id are needed,
- For GKE => module_id, and version_id
The .net core configuration files were used to provide the above information for each deployment:
_appsettings.json_
{
  "GCP": {
    "ServiceID": "my-service",
    "VersionID": "v1"
  }
}
_appsettings.Development.json_
{
  "GCP": {
    "ID": "my-id"
  }
}
Basically, the above will render the following configuration:
- On Local execution
```c#
return WebHost.CreateDefaultBuilder(args)
.UseGoogleDiagnostics("my-id", "my-service", "v1")
.UseStartup();
2. On GKE
```c#
return WebHost.CreateDefaultBuilder(args)
    .UseGoogleDiagnostics(null, "my-service", "v1")
    .UseStartup<Startup>();
To guarantee i'm using the correct information, i used two places on the GCP UI to verify:
- On Endpoints Listing, checked the service details:
Service name: my-service Active version: v1
- Checked the Endpoint logs, for a specific API POST Endpoint
{
insertId: "e6a63a28-1451-4132-ad44-a4447c33a4ac@a1"

jsonPayload: {…}
 logName: "projects/xxx%2Fendpoints_log"
 receiveTimestamp: "2019-07-11T21:03:34.851569606Z"

resource: {

labels: {
   location: "us-central1-a"
   method: "v1.xxx.ApiOCRPost"
   project_id: "my-id"
   service: "my-service"
   version: "v1"
  }
  type: "api"
 }
 severity: "INFO"
 timestamp: "2019-07-11T21:03:27.397632588Z"
}
Is there a BUG?
When executing the service Endpoints, for each specific deployment, Google Cloud Diagnostics behaves differently:
- On Local execution (VS2017) => Logging, Tracing and Error Reporting work as expected, everything showing in GCP UI
- On GKE Deployment => Logging, Tracing and Error Reporting DO NOT Work, nothing shows in GCP UI
I've tried several variations, hardcoding the values directly in the code, etc, but no matter what i do, Google Cloud Diagnostics is not working when deployed in GKE:
- Hardcoding the values directly
```c#
return WebHost.CreateDefaultBuilder(args)
.UseGoogleDiagnostics(null, "my-service", "v1")
.UseStartup();
2. Without the v in Version
```c#
return WebHost.CreateDefaultBuilder(args)
    .UseGoogleDiagnostics(null, "my-service", "1")
    .UseStartup<Startup>();
Am i doing anything wrong or is it a bug on Google.Cloud.Diagnostics.AspNetCore 3.0.0-beta13?
Environment details
- .NET version: 2.2.0
- Package name and version: Google.Cloud.Diagnostics.AspNetCore 3.0.0-beta13
 vsspt
vsspt
All 45 comments
Thanks for reporting this - I've had Google.Cloud.Diagnostics.AspNetCore working before, although it's not been as smooth as I'd have liked.
Note that the table isn't "information needed" so much as "information provided by MonitoredResource" (when that's working properly). So I wouldn't be entirely surprised at having to provide some information manually, but at that point, it should work. I'll try to reproduce this on Monday and we can work out where to go from there.
 jskeet
on 13 Jul 2019
jskeet
on 13 Jul 2019
Thank you very much for the quick reply.
Please note that on a GKE deployment, even when passing all the parameters, it still didn't work:
```c#
return WebHost.CreateDefaultBuilder(args)
.UseGoogleDiagnostics("my-id", "my-service", "1")
.UseStartup
```c#
return WebHost.CreateDefaultBuilder(args)
    .UseGoogleDiagnostics("my-id", "my-service", "v1")
    .UseStartup<Startup>();
Regarding the Version_ID parameter, should it be sent as "v1" or simply "1" ?
vsspt
on 13 Jul 2019
Will look in detail on Monday.
jskeet
on 13 Jul 2019
Okay, investigation log...
- Create a new solution in VS2019
- Create a new project, selecting ASP.NET Core, then "API" template using ASP.NET Core 2.1, without configuring for HTTPS or Docker (just for simplicity).
- Set the default log level to Information in appsettings.json so we can see a log entry for each request
- Deploy to GKE via Cloud Build (run "dotnet publish" locally, then upload results with a Dockerfile and Cloud Build config that builds the docker image, publishes it and update the GKE deployment). I can share these files if necessary, but they shouldn't be relevant.
- Visit (address)/api/values - yes, it's working
- Visit the Log Viewer - the logs are shown under "GKE Container" -> "diagnostics-test" (the name of my GKE service) - these come from the console
- In
ValuesController.Get(int id), add code to throw an exception if the input is negative - Redeploy, and visit /api/values/-10
- Error is shown in the logs, but only as info; nothing in error reporting
- Add dependency to Google.Cloud.Diagnostics.AspNetCore 3.0.0-beta13
- Add
.UseGoogleDiagnostics(projectId, "diagnostics-test", "v1")to Program.cs - Redeploy, and visit /api/values
- Visit the Log Viewer - the logs are now shown under "GKE Container" -> "aspnetcore" (the default log name)
- Visit /api/values/-20 and check the logs: this time there's an error log level, and the error is logged to Error Reporting
So, it looks like it's working for me when all the values are specified, but:
- The default log name is aspnetcore (which I agree isn't ideal; I want to improve that)
- I haven't tried without specifying the various fields yet; I suspect that autodetection of the project ID may run foul of this issue
Let's try to get your application working to the same level as my test app, and then we can make progress from there together.
jskeet
on 15 Jul 2019
Thank you very much for your feedback.
Tomorrow i will create a specific project, based on your analysis, to provide the information you requested.
vsspt
on 15 Jul 2019
I was able to execute all the steps in your detailed response.
I've created a simple .net core REST API in .net core 2.1, and followed your instructions ( I used VS 2017).
Until adding _.UseGoogleDiagnostics_, i've got the following logs from the log console, under _GKE Container -> dev3-cluster_:
The Log for the successful operation:
2019-07-15 22:40:29.265 BST GET Method Invoked with ID:12345
{
 insertId: "t58t5ig10rya1x"

labels: {
  compute.googleapis.com/resource_name: "gke-dev3-cluster-node-pool-c639236e-mrrb"
  container.googleapis.com/namespace_name: "default"
  container.googleapis.com/pod_name: "my-service-769b6bdc9d-kn5z2"
  container.googleapis.com/stream: "stdout"
 }
 logName: "projects/dev/logs/my-service"
 receiveTimestamp: "2019-07-15T21:40:34.815778174Z"

resource: {

labels: {
   cluster_name: "dev3-cluster"
   container_name: "my-service"
   instance_id: "5632450518254185334"
   namespace_id: "default"
   pod_id: "my-service-769b6bdc9d-kn5z2"
   project_id: "my-project-id"
   zone: "us-central1-a"
  }
  type: "container"
 }
 severity: "INFO"
 textPayload: "      GET Method Invoked with ID:12345
"
 timestamp: "2019-07-15T21:40:29.265524017Z"
}
The log when sending a negative value:
2019-07-15 22:42:17.535 BST System.Exception: Id cannot be Negative:-54321 at GoogleDiagnosticsTest.Controllers.ValuesController.Get(Int32 id) in /src/GoogleDiagnosticsTest/Controllers/ValuesController.cs:line 36 at lambda_method(Closure , Object , Object[] ) at
After adding _.UseGoogleDiagnostics("my-project-id", "diagnostics-test", "v1")_, the logs still apear under _GKE Container -> dev3-cluster_:
The Log for the successful operation:
2019-07-15 22:57:54.568 BST GET Method Invoked with ID:123499
{
 insertId: "be17vcfy2os3x"

jsonPayload: {
  log_name: "GoogleDiagnosticsTest.Controllers.ValuesController"
  message: "GET Method Invoked with ID:123499"
  scope: "ConnectionId:0HLO9DTUDN88Q => RequestId:0HLO9DTUDN88Q:00000001 RequestPath:/api/values/123499 => GoogleDiagnosticsTest.Controllers.ValuesController.Get (GoogleDiagnosticsTest) => "
 }

labels: {
  trace_identifier: "0HLO9DTUDN88Q:00000001"
 }
 logName: "projects/dev/logs/aspnetcore"
 receiveTimestamp: "2019-07-15T21:57:57.418466292Z"

resource: {

labels: {
   cluster_name: "dev3-cluster"
   container_name: ""
   instance_id: "6880185264166234998"
   namespace_id: "default"
   pod_id: "my-service-769b6bdc9d-4k6ht"
   project_id: "my-project-id"
   zone: "us-central1-a"
  }
  type: "container"
 }
 severity: "INFO"
 timestamp: "2019-07-15T21:57:54.568968600Z"
 trace: "projects/dev/traces/6da53c4682a18e8ec52141de9dbfeb22"
}
The Error was now correctly presented in the Error Logging UI.
Up until this point, i successfully replicated your results, with both Logging and Error Reporting working correctly.
Unfortunately, there seems to be a problem with tracing.
I added a Tracer to the Get/{id} operation:
```c#
[HttpGet("{id}")]
public ActionResult
{
using (_tracer.StartSpan(id.ToString()))
{
_logger.LogInformation("GET Method Invoked with ID:" + id);
            if (id >= 0) return id.ToString();
        }

        _logger.LogError("ID cannot be Negative:" + id);
        throw new Exception("Id cannot be Negative:" + id);
    }
```
Although the operation was successfully Logged, there is no Trace information in the Tracing UI.
Finally, i executed the project locally, running from VS2017:
- Tracing Works, Tracing UI present the following information:

After the above tests, my results were:
- When deploying in GKE, Logging and Error Reporting Works, Tracing does not.
- When deploying locally, Tracing works.
Please verify, and please inform if you need any specific information from me.
Regards.
vsspt
on 16 Jul 2019
After adding .UseGoogleDiagnostics("my-project-id", "diagnostics-test", "v1"), the logs still apear under GKE Container -> dev3-cluster
That's surprising - I would expect the log name to default to aspnetcore - which I don't like in terms of default behaviour, but it's what I observe.
Indeed, the JSON you showed included logName: "projects/dev/logs/aspnetcore" which should mean it shows up under aspnetcore in the UI.
I'll try to reproduce your tracing results.
jskeet
on 16 Jul 2019
Ah, I've just seen - you were scoping to the cluster. I seem to remember there are changes to logging around how things are grouped, which could explain this. It's possibly related to https://cloud.google.com/monitoring/kubernetes-engine/migration - I'll need to investigate more.
jskeet
on 16 Jul 2019
Hmm... I've had exactly the opposite experience. Running locally, I didn't get any logs or tracing (I need to work out why) but in GKE I get the kind of timeline you've shown.
Could you have another look for the traces that you logged back when you ran your earlier test? I know sometimes it can take a little while for traces to propagate. Also, could you confirm whether there are any traces? I initially saw some traces show with just the URI, but no "inner trace" - which I suspect is due to looking at the traces very shortly after they'd happened.
Also, could you show how you're initializing your logger and tracer? I've just got:
public ValuesController(ILoggerFactory loggerFactory, IManagedTracer tracer)
{
    _logger = loggerFactory.CreateLogger<ValuesController>();
    _tracer = tracer;
}
I've just confirmed in the Tracing UI, and i only have tracing on the Operation that was executed when running locally.
I'm initializing Logger, Tracing and Error Reporting as defined here:
The easiest way to initialize Google Diagnostics services in ASP.NET Core 2.0 or higher is using the UseGoogleDiagnostics extentension method on IWebHostBuilder. This configures Logging, Tracing and Error Reporting middleware.
_Program.cs_
c#
        public static IWebHostBuilder CreateWebHostBuilder(string[] args) =>
            WebHost.CreateDefaultBuilder(args)
                .UseGoogleDiagnostics("my-project-id", "diagnostics-test", "v1")
                .UseStartup<Startup>();
vsspt
on 16 Jul 2019
I'm initializing Logger, Tracing and Error Reporting as defined here:
But that doesn't provide you any fields. Your code uses _tracer and _logger, and you haven't shown how you've initialized those. See the code in my comment - that's how I've initialized them (along with the same UseGoogleDiagnostics call you're using) and it was fine. If you've initialized your fields in a different way, that could be the problem. It may not be, but I thought it was worth checking out.
jskeet
on 16 Jul 2019
I'm assuming that when using _.UseGoogleDiagnostics("my-project-id", "diagnostics-test", "v1")_, the Logging, Tracing, and Error Logging capabilities become available to the "project", and can be injected by DI:
```C#
[Route("api/[controller]")]
[ApiController]
public class ValuesController : ControllerBase
{
private readonly ILogger
private readonly IManagedTracer _tracer;
    public ValuesController(ILogger<ValuesController> logger, IManagedTracer tracer)
    {
        _logger = logger;
        _tracer = tracer;
    }
....
```
vsspt
on 16 Jul 2019
Right, so it's basically equivalent to what I've done, barring using a logger factory vs a logger.
In that case I'm really confused as to why the code is working for me but not for you. I'll look into why it wasn't working _locally_ for me (despite that working for you), as that might give me some avenues to explore. Apologies that this is taking a while to diagnose - issues with diagnostics libraries tend to be tricky to pin down, I'm afraid :(
jskeet
on 16 Jul 2019
Thank you very much for taking the time to look at this.
If you need any information, please ask, i may not be available immediately due to timezone diferences, but i will try to provide you the information you need as soon as possible.
This afternoon i will also repeat my tests to check if i'm doing anything wrong, as i don't want you to waste your time due to any potential mistake i may have made ...
vsspt
on 16 Jul 2019
Just for the sake of having similar code, i added a Logger Factory:
```c#
[Route("api/[controller]")]
[ApiController]
public class ValuesController : ControllerBase
{
private readonly ILogger
private readonly IManagedTracer _tracer;
    public ValuesController(ILoggerFactory logFactory, IManagedTracer tracer)
    {
        _logger = logFactory.CreateLogger<ValuesController>();
        _tracer = tracer;
    }
```
For Local Tests (Running through VS2017):
- Tracing works correctly, operation is presented in GCP Tracing UI
- Logging is sent to VS Console
- GCP Error Tracing UI does not present Errors.
Tracing UI Image:

vsspt
on 16 Jul 2019
When Deployed in a GKE:
- Tracing does NOT Work,
- Logging is correctly sent to GCP Logging UI
- Error Tracing is correctly sent to GCP Error Tracing UI
Logged operation:
2019-07-16 16:03:10.127 BST GET Method Invoked with ID:999
{
 insertId: "3me0d0g1fhvz90"

jsonPayload: {
  log_name: "GoogleDiagnosticsTest.Controllers.ValuesController"
  message: "GET Method Invoked with ID:999"
  scope: "ConnectionId:0HLO9VQRLA0AC => RequestId:0HLO9VQRLA0AC:00000001 RequestPath:/api/values/999 => GoogleDiagnosticsTest.Controllers.ValuesController.Get (GoogleDiagnosticsTest) => "
 }

labels: {
  trace_identifier: "0HLO9VQRLA0AC:00000001"
 }
 logName: "projects/my-project-id/logs/aspnetcore"
 receiveTimestamp: "2019-07-16T15:03:13.372478571Z"

resource: {

labels: {
   cluster_name: "my-project-id3-cluster"
   container_name: ""
   instance_id: "8009468853618759780"
   namespace_id: "default"
   pod_id: "my-service-769b6bdc9d-4r7sn"
   project_id: "my-project-id"
   zone: "us-central1-a"
  }
  type: "container"
 }
 severity: "INFO"
 timestamp: "2019-07-16T15:03:10.127326600Z"
 trace: "projects/my-project-id/traces/46bdc016cc6aacdb651061a3a19a1186"
}
Error Reporting:

vsspt
on 16 Jul 2019
So just to check, you don't see any traces, or you don't see the "nested" traces? I wonder whether there's some permissions issue... I'll dig into it tomorrow, and I may have some alternative code to test, using the tracing API directly to see if that helps clarify things. (It would be purely to work out what's going on - this code really should work.)
One other thing you might be able to try before then is to include the service account credential you used locally in your web app, and set GOOGLE_APPLICATION_CREDENTIALS to refer to it in your Dockerfile, so that you're using the exact same credentials in both places. (Otherwise you'll be using the default Compute credential when running in GKE, I believe.)
jskeet
on 16 Jul 2019
(I'm going to edit the subject line of the issue for clarity.)
jskeet
on 16 Jul 2019
I'm not sure if i fully understood your questions, but when running on GKE, i cannot see any trace on the Tracing Menu Options, neither on Overview, Trace List, etc:

I'm available for all the tests you need me to ...
I'm going to include GOOGLE_APPLICATION_CREDENTIALS in Docker file, and i will report back in about 30m.
vsspt
on 16 Jul 2019
Right. What I meant was that in the screenshots you've shown, there are two traces, one nested inside the other - I wasn't sure whether you weren't seeing anything, or were only seeing one bar. So thanks for clarifying that.
jskeet
on 16 Jul 2019
Just included the credentials Json file on the docker image, and set the GOOGLE_APPLICATION_CREDENTIALS to the credentials file.
Same result, Invoked the Endpoint, and there is no Tracing in the Tracing UI.
vsspt
on 16 Jul 2019
Okay - it was a long-shot, but at least it's good to have ruled it out. Will come up with something else for you to try tomorrow :)
jskeet
on 16 Jul 2019
Okay, so I've worked out what was wrong locally for me - that was due to a credentials issue. (The account I was using locally didn't have permission to write traces.) Unfortunately it's not currently easy to see that exception - I'll file a new issue about that.
In the meantime, I'll also try some code to call the tracing API directly.
jskeet
on 17 Jul 2019
Okay, here's the next change to try:
- Remove the UseGoogleDiagnostics call in Program.cs (just to simplify things - this will revert to console logging)
- Remove the _tracer and _logger fields, and the constructor
Change the Get(int) method to this code:
[HttpGet("{id}")]
public ActionResult<string> Get(int id)
{
    if (id == 9999)
    {
        TraceServiceClient client = TraceServiceClient.Create();
        string projectId = "YOUR PROJECT ID HERE";
        var span = new TraceSpan
        {
            Name = "Manual",
            StartTime = DateTime.UtcNow.ToTimestamp(),
            EndTime = DateTime.UtcNow.AddSeconds(1).ToTimestamp(),
            SpanId = 1L
        };
        var trace = new Trace
        {
            ProjectId = projectId,
            Spans = { span },
            TraceId = Guid.NewGuid().ToString().Replace("-", "")
        };
        var traces = new Traces
        {
            Traces_ = { trace }
        };
        client.PatchTraces(projectId, traces);
    }

    if (id < 0)
    {
        throw new Exception("Negative input");
    }
    return "value";
}
You'll need these using directives:
using Google.Cloud.Trace.V1;
using Google.Protobuf.WellKnownTypes;
First run it locally, and visit /api/values/9999 and see whether that succeeds - I'd expect it to, leaving a trace in Stackdriver with a URI of "Manual". Then deploy it to GKE and visit the same page:
- If the request succeeds, you should see another trace in Stackdriver
- If the request fails, have a look in the Stackdriver logs to see if there's an exception (which is what I'd expect)
jskeet
on 17 Jul 2019
On a Local deploy, Trace works as expected:

On a GKE deploy, i've got the following error:
{
 insertId: "3cfyy1g1dv72qz"

labels: {
  compute.googleapis.com/resource_name: "gke-dev3-cluster-node-pool-0aa4a9b5-438n"
  container.googleapis.com/namespace_name: "default"
  container.googleapis.com/pod_name: "my-service-6665d55b48-8scvz"
  container.googleapis.com/stream: "stdout"
 }
 logName: "projects/dev/logs/my-service"
 receiveTimestamp: "2019-07-17T13:34:42.499499350Z"

resource: {

labels: {
   cluster_name: "dev3-cluster"
   container_name: "my-service"
   instance_id: "8602512414522646266"
   namespace_id: "default"
   pod_id: "my-service-6665d55b48-8scvz"
   project_id: "dev"
   zone: "us-central1-a"
  }
  type: "container"
 }
 severity: "INFO"
 textPayload: "Grpc.Core.RpcException: Status(StatusCode=PermissionDenied, Detail="The caller does not have permission")
   at Grpc.Core.Internal.AsyncCall`2.UnaryCall(TRequest msg)
   at Grpc.Core.DefaultCallInvoker.BlockingUnaryCall[TRequest,TResponse](Method`2 method, String host, CallOptions options, TRequest request)
   at Grpc.Core.Interceptors.InterceptingCallInvoker.<BlockingUnaryCall>b__3_0[TRequest,TResponse](TRequest req, ClientInterceptorContext`2 ctx)
   at Grpc.Core.ClientBase.ClientBaseConfiguration.ClientBaseConfigurationInterceptor.BlockingUnaryCall[TRequest,TResponse](TRequest request, ClientInterceptorContext`2 context, BlockingUnaryCallContinuation`2 continuation)
   at Grpc.Core.Interceptors.InterceptingCallInvoker.BlockingUnaryCall[TRequest,TResponse](Method`2 method, String host, CallOptions options, TRequest request)
   at Google.Cloud.Trace.V1.TraceService.TraceServiceClient.PatchTraces(PatchTracesRequest request, CallOptions options)
   at Google.Api.Gax.Grpc.ApiCall.GrpcCallAdapter`2.CallSync(TRequest request, CallSettings callSettings)
   at Google.Api.Gax.Grpc.ApiCallRetryExtensions.<>c__DisplayClass1_0`2.<WithRetry>b__0(TRequest request, CallSettings callSettings)
   at Google.Cloud.Trace.V1.TraceServiceClientImpl.PatchTraces(PatchTracesRequest request, CallSettings callSettings)
   at GoogleDiagnosticsTest.Controllers.ValuesController.Get(Int32 id) in /src/GoogleDiagnosticsTest/Controllers/ValuesController.cs:line 57
   at lambda_method(Closure , Object , Object[] )
   at Microsoft.Extensions.Internal.ObjectMethodExecutor.Execute(Object target, Object[] parameters)
   at Microsoft.AspNetCore.Mvc.Internal.ActionMethodExecutor.SyncObjectResultExecutor.Execute(IActionResultTypeMapper mapper, ObjectMethodExecutor executor, Object controller, Object[] arguments)
   at Microsoft.AspNetCore.Mvc.Internal.ControllerActionInvoker.InvokeActionMethodAsync()
   at Microsoft.AspNetCore.Mvc.Internal.ControllerActionInvoker.InvokeNextActionFilterAsync()
   at Microsoft.AspNetCore.Mvc.Internal.ControllerActionInvoker.Rethrow(ActionExecutedContext context)
   at Microsoft.AspNetCore.Mvc.Internal.ControllerActionInvoker.Next(State& next, Scope& scope, Object& state, Boolean& isCompleted)
   at Microsoft.AspNetCore.Mvc.Internal.ControllerActionInvoker.InvokeInnerFilterAsync()
   at Microsoft.AspNetCore.Mvc.Internal.ResourceInvoker.InvokeNextResourceFilter()
   at Microsoft.AspNetCore.Mvc.Internal.ResourceInvoker.Rethrow(ResourceExecutedContext context)
   at Microsoft.AspNetCore.Mvc.Internal.ResourceInvoker.Next(State& next, Scope& scope, Object& state, Boolean& isCompleted)
   at Microsoft.AspNetCore.Mvc.Internal.ResourceInvoker.InvokeFilterPipelineAsync()
   at Microsoft.AspNetCore.Mvc.Internal.ResourceInvoker.InvokeAsync()
   at Microsoft.AspNetCore.Builder.RouterMiddleware.Invoke(HttpContext httpContext)
   at Microsoft.AspNetCore.Server.Kestrel.Core.Internal.Http.HttpProtocol.ProcessRequests[TContext](IHttpApplication`1 application)
"
 timestamp: "2019-07-17T13:34:37.549195582Z"
}
Aha! That's definite progress. That suggests that when you tried including the service account file and setting GOOGLE_APPLICATION_CREDENTIALS, something must have gone wrong. (It's hard to know what.)
I'd expect GKE to use the "Compute Engine default service account" by default - could you check the permissions of that within the project?
jskeet
on 17 Jul 2019
I'm sorry, could you please guide me on how to obtain the information you requested?
vsspt
on 17 Jul 2019
Go into the IAM console. That should show a list of accounts. Under "name", one of them will show "Compute Engine default service account". I'd expect that to be the account used by GKE. Check the listed roles - in my project, it's in the "Editor" role which gives a lot of permissions.
However, it's also possible that GKE-specific permissions are causing the problem. (This is somewhat out of my depth, I'm afraid - it's a complex area! I can find someone with more expertise if necessary.) To check this, find your cluster in the GKE console and see what it's got under "Permissions". In my cluster, "Cloud Platform" is enabled which gives permission for the other APIs... I wonder whether on your cluster, Logging may be enabled but not Tracing.
jskeet
on 17 Jul 2019
I don't have a complete knowledge on the our services are being deployed, as this is handled by other team members. They use Terraform + Helm, and i'm not 100% familiar with it.
Regarding the information you requested:
On IAM console,
- I don't have "Compute Engine default service account", there are only a set of specific service accounts, for specific project users.
On GKE console, Permissions show that this specific account:

On IAM Console, these are the permissions assigned to the above user:

Could the problem be due to the lack of Trace specific roles to the above user.
I tried to add Trace Admin Role, but it didn't work.
vsspt
on 17 Jul 2019
I'm surprised you don't have a compute engine default service account, but maybe things have changed. However, it looks like you've found the right account... and note how it has logs write access, but not trace access.
If you add the role of "Cloud Trace Agent" to that service account, I expect that will solve the problem.
jskeet
on 17 Jul 2019
I've just added the Cloud Trace Agent to Permission to the Service account (via Terraform):
# For Agent access to Stackdriver Trace. Can write trace data.
resource "google_project_iam_member" "cloudtrace-agent-role" {
  role   = "roles/cloudtrace.agent"
  member = "serviceAccount:${google_service_account.gke_node_service_account.email}"
}
The service account now has the Trace Agent Role:

And here we can see the cluster is indeed using this service account:

Unfortunately, it still doesn't work :(
{
 insertId: "r774xkg1hcns6v"

labels: {
  compute.googleapis.com/resource_name: "gke-dev3-cluster-node-pool-ef9fc9f7-kzt1"
  container.googleapis.com/namespace_name: "default"
  container.googleapis.com/pod_name: "my-service-6665d55b48-4d8pw"
  container.googleapis.com/stream: "stdout"
 }
 logName: "projects/dev/logs/my-service"
 receiveTimestamp: "2019-07-17T22:17:53.993497454Z"

resource: {

labels: {
   cluster_name: "dev3-cluster"
   container_name: "my-service"
   instance_id: "1317765787607508478"
   namespace_id: "default"
   pod_id: "my-service-6665d55b48-4d8pw"
   project_id: "dev"
   zone: "us-central1-a"
  }
  type: "container"
 }
 severity: "INFO"
 textPayload: "Grpc.Core.RpcException: Status(StatusCode=PermissionDenied, Detail="The caller does not have permission")
   at Grpc.Core.Internal.AsyncCall`2.UnaryCall(TRequest msg)
   at Grpc.Core.DefaultCallInvoker.BlockingUnaryCall[TRequest,TResponse](Method`2 method, String host, CallOptions options, TRequest request)
   at Grpc.Core.Interceptors.InterceptingCallInvoker.<BlockingUnaryCall>b__3_0[TRequest,TResponse](TRequest req, ClientInterceptorContext`2 ctx)
   at Grpc.Core.ClientBase.ClientBaseConfiguration.ClientBaseConfigurationInterceptor.BlockingUnaryCall[TRequest,TResponse](TRequest request, ClientInterceptorContext`2 context, BlockingUnaryCallContinuation`2 continuation)
   at Grpc.Core.Interceptors.InterceptingCallInvoker.BlockingUnaryCall[TRequest,TResponse](Method`2 method, String host, CallOptions options, TRequest request)
   at Google.Cloud.Trace.V1.TraceService.TraceServiceClient.PatchTraces(PatchTracesRequest request, CallOptions options)
   at Google.Api.Gax.Grpc.ApiCall.GrpcCallAdapter`2.CallSync(TRequest request, CallSettings callSettings)
   at Google.Api.Gax.Grpc.ApiCallRetryExtensions.<>c__DisplayClass1_0`2.<WithRetry>b__0(TRequest request, CallSettings callSettings)
   at Google.Cloud.Trace.V1.TraceServiceClientImpl.PatchTraces(PatchTracesRequest request, CallSettings callSettings)
   at GoogleDiagnosticsTest.Controllers.ValuesController.Get(Int32 id) in /src/GoogleDiagnosticsTest/Controllers/ValuesController.cs:line 57
   at lambda_method(Closure , Object , Object[] )
   at Microsoft.Extensions.Internal.ObjectMethodExecutor.Execute(Object target, Object[] parameters)
   at Microsoft.AspNetCore.Mvc.Internal.ActionMethodExecutor.SyncObjectResultExecutor.Execute(IActionResultTypeMapper mapper, ObjectMethodExecutor executor, Object controller, Object[] arguments)
   at Microsoft.AspNetCore.Mvc.Internal.ControllerActionInvoker.InvokeActionMethodAsync()
   at Microsoft.AspNetCore.Mvc.Internal.ControllerActionInvoker.InvokeNextActionFilterAsync()
   at Microsoft.AspNetCore.Mvc.Internal.ControllerActionInvoker.Rethrow(ActionExecutedContext context)
   at Microsoft.AspNetCore.Mvc.Internal.ControllerActionInvoker.Next(State& next, Scope& scope, Object& state, Boolean& isCompleted)
   at Microsoft.AspNetCore.Mvc.Internal.ControllerActionInvoker.InvokeInnerFilterAsync()
   at Microsoft.AspNetCore.Mvc.Internal.ResourceInvoker.InvokeNextResourceFilter()
   at Microsoft.AspNetCore.Mvc.Internal.ResourceInvoker.Rethrow(ResourceExecutedContext context)
   at Microsoft.AspNetCore.Mvc.Internal.ResourceInvoker.Next(State& next, Scope& scope, Object& state, Boolean& isCompleted)
   at Microsoft.AspNetCore.Mvc.Internal.ResourceInvoker.InvokeFilterPipelineAsync()
   at Microsoft.AspNetCore.Mvc.Internal.ResourceInvoker.InvokeAsync()
   at Microsoft.AspNetCore.Builder.RouterMiddleware.Invoke(HttpContext httpContext)
   at Microsoft.AspNetCore.Server.Kestrel.Core.Internal.Http.HttpProtocol.ProcessRequests[TContext](IHttpApplication`1 application)
"
 timestamp: "2019-07-17T22:17:49.740047876Z"
}
Now with the added Trace Agent, although i'm not getting the Tracing for my operations with _tracer.startSpan, i'm seeing these type of Traces for each method invocation:
 vsspt
on 18 Jul 2019
vsspt
on 18 Jul 2019
Tried the Cloud Trace User Role, some error ....
vsspt
on 18 Jul 2019
Cloud Trace User is a "viewer" kind of role - your service account won't need that unless it needs to consume traces. It's good to see that your cluster can definitely log now.
I don't follow what you did between your "Unfortunately, it still doesn't work :(" comment and "Now with the added Trace Agent" - was that just a matter of waiting a few minutes for the permissions to take hold? Or do you mean that the manual tracing step still doesn't work, but those new traces have appeared independently?
Is the manual trace code (calling the PatchTraces method in your controller) working now?
I notice there are two different service accounts you've shown in your comments - one ends with "dif19@xxx.dev.iam.gserviceaccount.com" and the other ends with "eiu9p@xxx.dev.iam.gserviceaccount.com". I don't understand which one is which - could you clarify please?
jskeet
on 18 Jul 2019
I'm sorry if i wasn't clear ...
With the Trace Agent Role added, i've got the following result:
- The manual Trace code (calling the PatchTraces method in the controller), still does NOT work, it gets the same error as before: "Grpc.Core.RpcException: Status(StatusCode=PermissionDenied, Detail="The caller does not have permission" (Please see the full log above),
- Although the Manual Trace does NOT work, for each method invocation, there is a Trace that is generated for ApiValuesByIdGet (Please see the image presented by the Trace UI above).
Regarding the different services accounts: we generate the Cluster infrastructure, service accounts, etc, using Terraform + Helm. To make sure the Service account was properly configured with the new Role, instead of just add the Role in the UI, i deleted the full Infrastructure, added the Role via Terraform, and created the infrastructure again. Every time the full infrastructure is created, it creates a new Service Account.
vsspt
on 18 Jul 2019
Hmm. It's possible that this is a difference in how the GKE authentication is performed. Could you let me know what your equivalent of the details below are like?
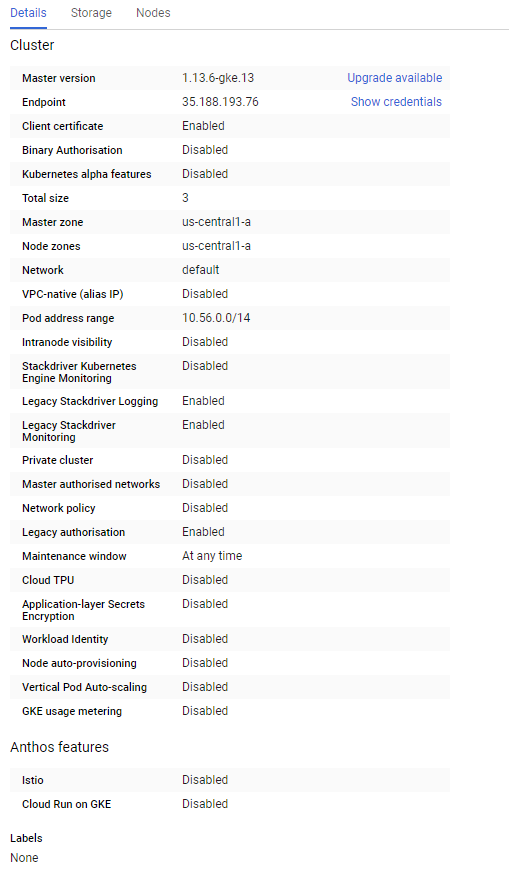
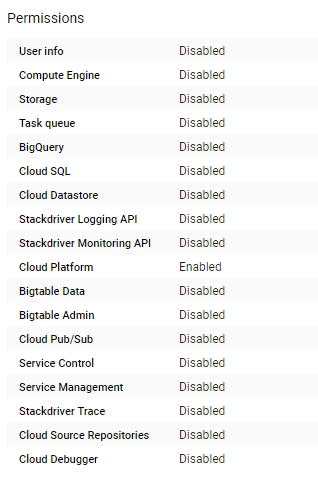
jskeet
on 18 Jul 2019
I've requested the help of a team member that created the Infrastructure in Terraform, and i was incorrectly setting the Cloudtrace Agent Role. After correcting the Terraform scripts, and re-creating the infrastructure, the service now has the Cloudtrace Agent Role correctly configured.
Regarding the Manual Trace, is now Working both on Local Deployment, and on GKE.
Once the Manual Trace was working on GKE, i then reverted the code to use the _UseGoogleDiagnostics_ extension method, and the use of __tracer.startSpan_.
```c#
using (_tracer.StartSpan("Tracing ID:" + id))
{
_logger.LogInformation("GET Method Invoked with ID:" + id);
            if (id >= 0) return id.ToString();
        }
The first test, was sending all Project_ID, Module_ID and Version_ID:
```c#
.UseGoogleDiagnostics("project-id", "diagnostics-test", "v1")
The results, when running on GKE are:
- Logging Tracing an error Reporting all Work correctly,
- Two types of Tracing appear on the GCP Trace UI:
The operation as a "sub-trace" of _ApiValuesByIdGet_

The Trace of the GET/{id} operation

The second test, was sending only, Module_ID and Version_ID.
According to the documentation, being deployed in GKE, we should not need the Project_ID.
Please note that the MODULE_ID and VERSION_ID are the same as before:
```c#
.UseGoogleDiagnostics(null, "diagnostics-test", "v1")
The results, when running on GKE are:
- Logging Works correctly,
- Tracing an error Reporting do NOT Work
- Only the "sub-trace" of _ApiValuesByIdGet_ appear on the GCP Trace UI.

The third test, was to use the REAL MODULE_ID/Service_Name:
```c#
.UseGoogleDiagnostics(null, "my-service-id", "v1")
The results, when running on GKE were the same as the second test:
- Logging Works correctly,
- Tracing an error Reporting do NOT Work
- Only the "sub-trace" of _ApiValuesByIdGet_ appear on the GCP Trace UI.
So, only two options remain:
- There is indeed a Bug on the Library
- I'm not sending the correct values on MODULE_ID, VERSION_ID.
vsspt
on 18 Jul 2019
I've finished work for the day, but I'll look tomorrow. I'm aware of some issues with resource detection in GKE (as linked earlier) but I don't know whether that's what's going wrong. Will look into it more. I'm glad it's working when everything is specified though.
jskeet
on 18 Jul 2019
Thank you very much for all the help, if you need any information, please ask!
vsspt
on 18 Jul 2019
I've made several new tests, and there seems to be some "inconsistencies" in the Tracing behavior:
- Sometimes, both traces apear, the "sub-trace" and the Operation Trace
- Sometimes, only one of them appear in the UI.
Here is the Trace list for a set of 3 sequential request, with ID's 16, 17, 18:

- Two of the requests (16 and 18) were Traced on the "sub-trace".
- One of the requests (17) was traced as the GET Operation.
For all the requests i'm doing, there is a random behavior, sometimes i get both traces, sometimes only the "sub-trace", sometimes only the Operation.
Just to clarify, the Operation is being Traces using the TracerManager:
c#
            using (_tracer.StartSpan("Tracing ID:" + id))
            {
                _logger.LogInformation("GET1 Method Invoked with ID:" + id);
                Task.Delay(2000).Wait();
            }
Is this a correct behavior?
Is this a bug?
I'm a bit lost, i'm not understanding what is the correct behavior for a Tracing Operation.
vsspt
on 18 Jul 2019
I think it would be best to focus on one issue at a time - this GitHub issue has meandered over various different topics. I've definitely observed the inconsistency aspect before, but usually when I looked at traces immediately - you may find that if you now look over the traces from yesterday, they're consistent. If they're not, please file a separate issue - which I'd expect to be in the situation of "specifying the project ID, module ID and version explicitly" to isolate this issue from that one.
I'll look into the project ID detection part today.
jskeet
on 19 Jul 2019
Hmm. The project ID detection is working okay for me. I've changed my code to use
.UseGoogleDiagnostics(null, "diagnostics-test", "v1")
... and both logging and tracing are working okay. So we still need to work out what's going on here.
I've got one theory - it could be due to the versions of the dependencies involved. Two next steps:
1) Add this in your Program.Main, right at the start (before CreateWebHostBuilder):
var platform = Google.Api.Gax.Platform.Instance();
Console.WriteLine($"Platform is: {platform}");
Please then deploy and see what's logged.
2) Update the dependencies.
Keep the code from step 1, but add a new manual dependency on Google.Api.Gax.Grpc version 2.9.0.
I previously had a a project dependency on the source code for Google.Cloud.Diagnostics.AspNetCore in order to diagnose tracing error. This would have meant newer dependencies - I'm trying again with 3.0.0-beta13 now.
jskeet
on 19 Jul 2019
Hmm... it's still working for me even with the slightly older dependencies. I'll wait to hear the result of the platform logging. For me, I see the following platform description:
[GKE: ProjectId='[redacted]', ClusterName='web-cluster', HostName='diagnostics-test-b58b97b74-pdt8b', InstanceId='3766454525711957745', Zone='projects/[redacted]/zones/us-central1-a', NamespaceId='default', PodId='diagnostics-test-b58b97b74-pdt8b', ContainerName='']
The container name being missing is due to the GAX issue, but the project ID has been determined correctly, and it's logging and tracing as expected.
jskeet
on 19 Jul 2019
Thank you very much once again for your detailed analysis.
Tracing and Logging are indeed working, even when Platform_ID is not sent:
```c#
.UseGoogleDiagnostics(null, "diagnostics-test", "v1")
I've made an error interpreting the last results, due to the inconsistency of the way Traces are displayed. I performed the same tests again, this time performing several sequential requests, and all of them where traced (although sometimes displayed as a sub-trace, sometimes as an Operation trace).

Nevertheless, i gather the information you requested.
Case 1:
```txt
[GKE: ProjectId='my-project', ClusterName='my-project3-cluster', HostName='my-service-769b6bdc9d-2mnbv', InstanceId='528582748313247073', Zone='projects/127296601443/zones/us-central1-a', NamespaceId='default', PodId='my-service-769b6bdc9d-2mnbv', ContainerName='']
Case 2, after updating Google.Api.Gax.Grpc to version 2.9.0:
Platform is: [GKE: ProjectId='my-project', ClusterName='my-project3-cluster', HostName='my-service-769b6bdc9d-rjgxw', InstanceId='528582748313247073', Zone='projects/127296601443/zones/us-central1-a', NamespaceId='default', PodId='my-service-769b6bdc9d-rjgxw', ContainerName='']
Once again, thank you very much for all the help you provided.
As Tracing is indeed working, please close this issue.
vsspt
on 19 Jul 2019
Hooray! I'm really glad we got there in the end. Thanks for all your patience :)
jskeet
on 19 Jul 2019
Related issues
 AliSheikhTaheri
·
6Comments
AliSheikhTaheri
·
6Comments
 Talento90
·
6Comments
Talento90
·
6Comments
 gabrielheming
·
7Comments
gabrielheming
·
7Comments
 haf
·
6Comments
haf
·
6Comments
 Thaina
·
3Comments
Thaina
·
3Comments